
U.S. LNG Expansion…..Is the industry facing headwinds for future expansions??
U.S. LNG Expansion…..Is the industry facing headwinds for future expansions??
By: Kindra Snow-McGregor, P.E., PetroSkills Discipline Manager Oil and Gas Processing, LNG
The Competency Alliance, a RelyOn Company
Abstract
The new US administration is aggressively supporting LNG as a key pillar in their American Energy Policy. The earlier pause in LNG export permit issues has been revoked, and the following projects have recently been issued non-FTA export permits:
- Delfin LNG ~ 13.3 mtpa [~1.92 bcfd]
- Golden Pass LNG extension ~ 18 mtpa [2.57 bcfd]
- Cheniere Corpus Christi Stage 3 Trains 8 and 9 ~ 1.49 mtpa [0.21 bcfd]
- Venture Global CP2 ~ 20 mtpa [2.86 bcfd]
The projects currently in operation, under construction, or that have reached final investment decision (FID) differ from non-U.S. LNG exporters in that they utilize transmission pipeline gas as their feed source. This approach eliminates the necessity for new field development and the associated raw gas conditioning processes. This enables shorter project timelines and reduced capital costs compared to "greenfield" projects in more challenging overseas environments, such as Mozambique. Currently, the US has ample supply of very “cheap” natural gas for purchase to feed these facilities, making US LNG economically competitive as compared to other LNG exporters.
Currently the U.S. exports roughly 100 mtpa [14.28 bcfd]1, is contributing roughly $400 billion to US GDP and supporting an average of 273,000 direct, indirect and induced US jobs2. The amount of LNG export under construction will increase US LNG export capacity to ~181 mtpa [25.85 bcfd] when completed1.The estimated Pre-FID “permitted” capacity (including the recent approvals) is approximately 144 mtpa [20.6 bcfd].
To provide context for these figures, the U.S. Energy Information Administration projects that U.S. natural gas production will reach approximately 105 billion cubic feet per day (bcfd) by 2025.3. Once the projects that are currently under construction are commissioned and operational ~ 25% of today’s current natural gas production will be exported.
If all the Pre-FID projects were to be built, approximately 44% of today’s US natural gas production would be exported as LNG1. To keep domestic natural gas prices low, it will be essential to increase both the production and transportation of natural gas in tandem with the commissioning and startup of these facilities.
Development of baseload liquefaction facilities involves substantial investment. For instance, the recently approved Venture Global CP2 project, which has a capacity of 20 million tons per annum (mtpa), is projected to cost around $28 billion.4.
Despite a favorable regulatory and permitting landscape, the industry is encountering several challenges in advancing projects to final investment decision (FID), as well as challenges with projects that are struggling to reach completion.
Differentiators of US LNG
The challenges include current project cost overruns (prior to the newly implemented tariffs), a tight skilled US labor market, a recent 25% tariff on steel and aluminum adding more uncertainty, and a potential tightening domestic natural gas market. This tip of the month (TOTM) will discuss the challenges that lie ahead.
Historically, the LNG value chain developed as a transport business which allowed gas to be sold from suppliers that had excess reserves / capacity (in the form of large reservoirs of stranded gas) to locations that had high demand and low reserves / capacity.
The first projects were integrated LNG projects which require the costs of the development and construction of the exploration and production (E&P) assets, liquification, the LNG carriers, as well as the terminal and regasification facilities that would deliver the gas to the end market. These billion-dollar projects were joint ventures between major international oil and gas companies and national utilities of the purchasing countries. An example of a fully integrated LNG value chain is provided in Figure 1 below:
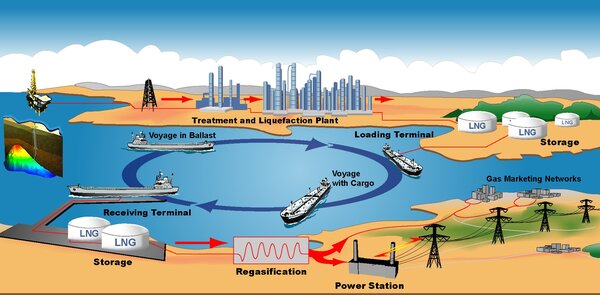
Figure 1. Integrated LNG Export Facility
In 2023 the US became the world’s largest exporter of LNG, maintaining that lead in 2024. The US’s remarkable rise to number one was achieved in seven short years; we were importing LNG prior to 2016. The stunning rapid growth of US LNG export capacity was made possible by the shale gas revolution which created a glut of low-cost domestic natural gas. US LNG exports have had major impacts on the global gas industry by providing sourcing flexibility, alternative pricing structures, and energy security to our allies in the EU and other nations.
The key differentiators of US LNG are as follows:
- Feed gas to these facilities is pipeline transmission gas which removes the requirement for exploration and production
- “Cheap” natural gas prices (Henry Hub, and the Waha Hub)
- The U.S. enforces some of the strictest greenhouse gas (GHG) emission regulations in the world, enhancing its competitiveness against other LNG-producing nations..
Figure 2 provides where US LNG fits within the US Natural Gas Value Chain5.
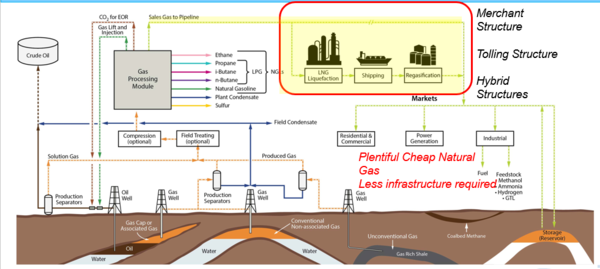
Figure 2. US LNG Value Chain5
Project Cost Overruns
In the past year, a couple of projects have run into unpredicted cost overruns, which could signal a potential worsening trend in the future due to the ongoing uncertainty surrounding supply chain costs.
On July 25, 2024, Zachry Holdings, along with 20 subsidiaries, filed for bankruptcy protection to withdraw from its position as the primary construction contractor for the Golden Pass LNG project.7
Zachry said the project was costing $30 – $40 million weekly while Golden Pass was set to pay $70 million monthly8, stating that the project was at least $2.4 billion over the original budget9. The exit of Zachry as primary contractor resulted in further project delays and resulted in the layoffs of 4,000 workers.
The project was initially estimated to be $9.25 billion in 2019. These costs ballooned by 25% in 2022 due to Covid 19 and other geopolitical issues. Currently it is estimated to be $11.6 billion dollars. Given these project delays, Golden Pass had to request and was granted a three-year extension for their export permit10.
Rueter’s reported in June of 2024 that labor costs were jumping as much as 20% since 2021, and data from LNG research and consulting firm Rapidan Energy Group showing that between 2021 and 2023 EPC contracts for new LNG plants increased between 18 – 25%11.
Another example of the challenges with these mega-projects is Venture Global’ s Plaquemines LNG facility costs were reported to be $2.35 billion over budget12. Venture Global blamed inflationary pressures and costs associated with keeping the project on schedule, likely attributed to increased labor costs.
LNG Skills Shortage in the Gulf Coast
According to The Global Energy Talent Index (GETI) Report 202513 the number of approaches that traditional energy professionals are experiencing for positions outside of their current company has been increasing year on year since 2023, with 5.8 job opportunities received on average.
The energy industry work force is aging, and the industry is not attracting young talent. According to GETI 20% of the workforce is 55 years +, with an additional 24% between the ages of 45 -55. Only 3% of the workforce < 24 years, and 21% 25 – 34.
The labor market in the U.S. LNG sector is even more constrained than that of the broader traditional oil and gas industry. There is intense competition for experienced and qualified professionals, as many of these projects are in relative proximity to one another, resulting in a highly competitive local labor market.
LNG experience in the US is difficult to find, given the industry is still quite “new” as the first LNG trains didn’t start up until 2016. Several LNG companies are creating apprenticeships for local students to help backfill the gap that will be left as the competition between sites becomes more intense as additional facilities come one line.
The skill gap between current US energy professionals that have either upstream or downstream experience creates the additional burden of ensuring new hires are trained and qualified to be working in the various positions, whether it be engineering, production, operations or maintenance.
LNG Contract Renegotiations – a Sign of the Times?
As reported by Reuters14, at least three LNG companies are looking to raise liquefaction fees and are trying to renegotiate their sales and purchase agreements (SPAs) with buyers. This push comes in response to rising construction, labor, and borrowing costs.
Higher export prices may decrease the competitive advantage of US LNG sales on the global market as compared to export facilities that are indexed to oil prices. This is especially relevant given the current administration's push for lower global crude oil prices, which can influence market dynamics and further impact the competitiveness of U.S. LNG in the international arena.
The LNG export facilities cited to be re-negotiating their costs are as follows:
- Mexico Pacific – Seguaro Energia ~ 15 mtpa
- Venture Global – CP2 LNG Facility ~ 20 mtpa
- Energy Transfer – Lake Charles ~ 16.5 mtpa
Venture Global stated that liquefaction fees could exceed $4/MMbtu, compared to the current typical rate of $2.25/MMbtu. This increase in costs is primarily attributed to the engineering, procurement, and construction of these projects, with inflation significantly raising the prices of equipment and materials.
The projected increase in liquefaction fees by Venture Global highlights the growing financial pressures faced by LNG projects that are currently under construction or trying to get to final investment decisions. Rising fees can impact the overall cost structure of LNG projects, affecting pricing for buyers and potentially altering market dynamics.
Brownfield LNG producers are not impacted by the rising costs of construction, typically have pricing agreements that are linked to inflation.
To provide perspective on the scale of these projects, consider the Cheniere Corpus Christi Stage 1 and 2 Project, which has a capacity of approximately 15 mtpa15:
- It includes 200 miles of installed pipe, equivalent to the length of the Grand Canyon.
- There are 2,300 miles of electrical cable, enough to cross the English Channel 40 times.
- The project utilizes 57,000 tons of structural steel, sufficient to construct 8 Eiffel Towers.
- It requires 100,000 yards of concrete, enough to build 2 Empire State Buildings.
When one looks at the amount of materials involved in one of these projects, it is easy to understand why and how cost and project timeline overruns happen.
The competitiveness of U.S. LNG could be undermined by several factors:
- Increasing liquefaction costs resulting from project cost overruns and a limited supply of skilled labor.
- Potential tightening in the domestic gas market as additional liquefaction capacity comes online.
Decreasing prices from competing suppliers with contracts linked to crude oil prices.
Increased Uncertainty due to tariffs
Given that the current administration has reinstated a 25% tariff on steel imports and increased the tariff on aluminum from 10% to 25%16 the costs for projects that have not made FID are at greater risk of prices for equipment and materials to increase further.
It remains to be seen what this will eventually do to equipment and materials pricing given that the tariffs just went into effect last month. There have been several equipment suppliers that have been adding contingency clauses on their equipment quotes to allow for price increases depending upon their actual costs at the time of manufacturing and delivering.
These tariffs only add to project risk and uncertainty for these massive facilities.
Potential Tightening of US Natural Gas Market
The US is the largest producer and consumer of natural gas in the world. In 2023 the US produced 100.2 bcfd, a 4.2 % increase over 2022 production according to the Energy Institute 2024 Statistical Review of World Energy, and the US consumed 85.8 bcfd of natural gas. The global natural gas consumption in 2023 was 388 bcfd17. The US produced 25.8% of global natural gas consumption and consumed approximately 22% of global consumption18.
In 2023 the US exported 84 million tonnes of LNG18, which is equivalent to 12 bcfd, or approximately 12% of US natural gas production.
The amount of LNG exports under construction will increase US LNG export capacity to ~181 mtpa [25.85 bcfd] when completed1. When these plants come online, the US could potentially be exporting 25% of its natural gas production unless natural gas production can increase to meet the rising demand.
U.S. natural gas consumption and exports are expected to rise in the future, driven by demand for power production, industrial processes, LNG, and AI data centers. Consequently, natural gas prices are projected to trend upward as well.
To meet this increasing demand, it is crucial that natural gas production levels and available pipeline transportation are sufficient to balance supply. If production and transport do not keep pace with demand, it could lead to price increases, posing additional challenges for LNG export facilities.
In Closing
The further expansion of the U.S. LNG industry is likely to encounter numerous challenges in the coming years. One significant hurdle is the ability of pre-final investment decision (pre-FID) projects to successfully secure sufficient sales and purchase agreements (SPAs) that can offset rising project costs. As these costs continue to increase, it remains uncertain how many projects will be able to attract the necessary investment and commitments to move forward.
The rising costs of construction due to inflation and a tight labor market make these final investment decisions more difficult due to the risk of project cost over-runs.
Trying to factor in what the net impact of the new tariffs on aluminum and steel to equipment and materials complicates matters for vendors, engineering, procurement and construction firms as well as the project sponsors trying to ensure their secured long-term agreements will cover the costs.
By: Kindra Snow-McGregor, P.E.
To learn more about the natural gas or LNG industry consider joining one of our courses:
Overview of Gas Processing, G-2
Gas Conditioning and Processing, G-4
Gas Conditioning and Processing, LNG Emphasis, G-4LNG
LNG Short Course: Technology and the LNG Value Chain, G-29
References:
- U.S. Department of Energy, “Energy, Economic, and Environmental Assessment of US LNG Exports”, Dec. 2024.
- S&P Global, “Major New US Industry at a Crossroads: a US LNG Impact Study – Phase 1, Report by Commodity Insights and Market Intelligence, Dec. 2024.
- US EIA Short-Term Energy Outlook, natural gas, Release Date: March 11, 2025.
- “Venture Global gets go-ahead for its third and largest US LNG project yet”, Lucy Hine, 19 March 2025, TradeWinds.
- Gas Conditioning and Processing, Volume 1: The Basic Principles, 9th Edition, 4th printing, July 2022.
- “Zachry, Golden Pass settle lawsuit, allowing bankruptcy to proceed”, Tracy Idell Hamilton, 25 July 2024, San Antonio Report.
- “Former Golden Pass LNG Contractor to emerge from bankruptcy by end of March”, Curtis Williams, 24 Jan 2025, Reuters.
- “Judge approves Zachary Holdings, Golden Pass LNG settlement, paving the way for project resumption”, Curtis Williams, 24 July 2024, Reuters.
- “11.6B Golden Pass LNG developers ask for a 3-year extension”, Julie Strupp, 10 Sept 2024, ConstructionDive.
- “Rising US labor costs threaten to derail new LNG projects”, Curtis Williams, 24 June 2024, Reuters.
- “Venture Global LNG’s second plant running over budget, document show”, Curtis Williams and Echo Wang, 18 Nov 2024.
- The Global Energy Talent Index Report 2025, 5 year trends report.
- “US LNG exporters seek to renegotiate deals to cover rising costs”, Curtis Williams and Chen Aizhu, 10 March 2025, Reuters.
- https://www.youtube.com/watch?v=R5kdKKuDW5E
- Fact Sheet: President Donald J. Trump Restores 232 Tariffs, The White House, 11 Feb. 2025.
- Energy Institute 2024 Statistical Review of World Energy
- IGU World LNG Report 2024