Part 1 – The United States Today & the Energy Parity of Renewables

Where is the United States Today?
In response to the Paris Climate Change Accord, many countries in the European Union are enacting climate policies to meet the agreements in the Paris Accord and mitigate and reduce GHG (Green House Gas) emissions. The overall goal is to achieve net-zero GHG emissions by 2050. To many, this is interpreted as moving towards a hydrocarbon free economy. For example, Italy just imposed an offshore exploration moratorium for oil and gas permits to focus on renewables instead [1]. The Netherlands is “Going off gas”, with Groningen being completely closed by 2030[2], and the country to be completely gas free by 2050.
In the United States, a group of 24 U.S. state governors has decided to require their states to adopt policies in an effort to meet the same goals, despite the United States pulling out of the Paris Climate Accord agreement. In becoming an Alliance member, states commit to [3]:
► Implement policies that advance the goals of the Paris Agreement, aiming to reduce GHG emissions by at least 26-28 percent below 2005 levels by 2025.
► Track and report the states’ progress to the global community in appropriate settings, including when the world convenes to take stock of the Paris Agreement.
► Accelerate new and existing policies to reduce carbon pollution and promote clean energy at the state and federal level.
This is in direct opposition to the current President’s position. Additionally, in opposition to the fact that the United States has become the world leader in energy production [4].
The question becomes, are these goals consistent with the environmental objectives, and the quality of life that major populations have come to enjoy and expect?
Today’s reality: hydrocarbons (oil, coal and natural gas) supply 85% of the global energy demand. Refer to Figure 1 – Energy Use by Source.
Twenty years ago, hydrocarbons provided roughly 87% of the global energy demand. During that time period, the world’s energy use increased by 50%. This is roughly equivalent to adding all of the 2017 OECD countries over that time period. (Organization for Economic Co-operation and Development, and includes the US, EU, and Japan). In 2018, wind and solar PV (Photovolatic) provided only 4% of the world’s total energy demands. Primary energy consumption grew at a rate of 2.9% – nearly doubled it’s 10-year average. This was the fastest growth since 2010.
2018 fuel consumption growth driven by natural gas which contributed 40% of the increase – all fuels grew faster than their 10-year average, apart from renewables, but they accounted for the second largest increment to energy growth
China, the US, and India accounted for more than two-thirds of the global increase in energy demand – with the US consumption expanding at its fastest rate in 30 years. Renewables grew by 14.5% slightly below their historical average.
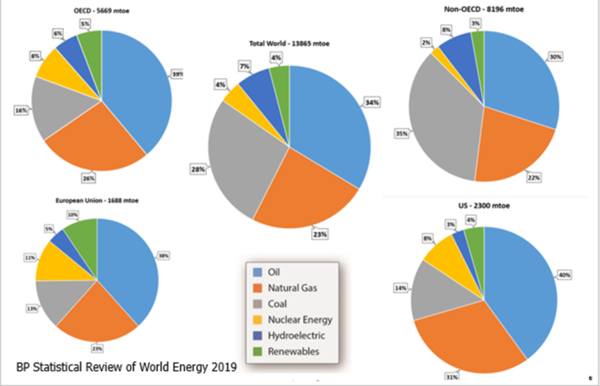
Figure 1. 2018 Energy Use by Source
Given the current Paris Accord goals some are trying to meet by 2050, it is highly unlikely that those goals will be achieved due to the current technology capabilities that we have. In fact, between population growth and per-capita energy demand CO2 emissions actually increased last year in most nations. This was largely a result of the increase in energy consumption. See Figures 2 and 3.
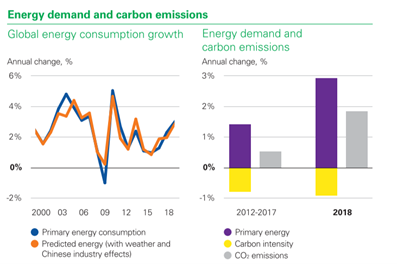
Figure 2. CO2 Emissions are growing
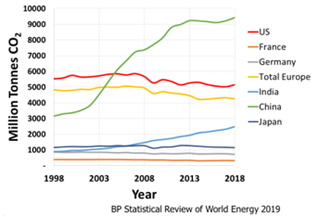
Figure 3. CO2 Emissions by Country
The European Union is close to achieving its targets through policy. However, there has been a price to pay as a result in terms of consumer cost. Their emissions remained flat for 2018. The U.S. emissions have largely been going down, but that is largely attributed to natural gas replacing coal. Despite many countries’ best efforts to reduce their carbon emissions, these reductions cannot counteract the amount of CO2 emissions that are greatly increasing from China and India as their economies modernize. Refer to Figures 3 and 4.
In terms of global CO2 emissions, in 2018, China alone represented 33% of the total, which is roughly equivalent to the combined emissions from the United States and Europe.
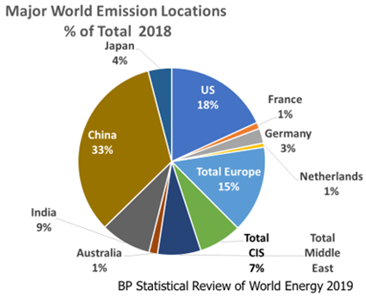
Figure 4. Largest CO2 Emission Locations 2018 [4]
Forgotten History in the United States
The U.S. first started producing oil in 1859 in Titusville, Pennsylvania. The demand for oil in the U.S. outpaced what local supply could deliver, and thus the U.S. became dependent upon imports from the Middle East. After WWII, in 1948 the allied powers carved out land in the British territory of Palestine to create the state of Israel to serve as a homeland for disenfranchised Jews. Many Middle Eastern countries were not happy with the agreement, which is still a source of much tension today.
The Yom Kipper War in 1973 Egypt and Syria attacked Israel. Russia started sending arms to Egypt and in response, U.S. President Nixon started supplying arms to Israel. Due to Nixon’s military support to Israel, OPEC (Organization of Petroleum Exporting Countries) reduced production and proclaimed an oil embargo of the United States. The oil embargo created a significant energy crisis in the U.S. This had a lasting impact – various acts of legislation during the 1970s sought to redefine America’s relationship to fossil fuels and other sources of energy.
As part of the movement toward energy reform, efforts were made to stimulate domestic oil production as well as to reduce American dependence on fossil fuels and find alternative sources of power, including renewable energy sources such as solar or wind power, as well as nuclear power.
The Carter Administration funded the Eastern Gas Shales Project (EGSP) which was aimed at increasing oil production out of Appalachian and Michigan basins using fracking technology. The Appalachian basin was one of the first shale plays to be targeted for fracking experiments. Current fracking technology would not be where it is today without the research funding of the Carter administration. This is likely one of the few success stories of government funded research. The funding of the EGSP continued through 1992.
It may be useful to consider what the energy embargo did to the U.S. economy and quality of living back in the 1970s. I personally remember the gasoline lines at the gas station and my family having to limit driving as a result of the embargos. Oil prices jumped by 350%, and the higher costs quickly rippled through the economy. Business and government asked consumers to help by conserving energy, the government was working on solutions but the economic crises worsened. As a result of the high cost of energy, the cost of living increased significantly. This resulted in massive lay-offs of workers and inflation became problematic. During that time, it appeared that perhaps the American dream was dead.
Fortunately, the fracking research that was initiated during the energy crises is the foundation of the shale gas boom that the US started experiencing in roughly 2010. As a result, today the United States is the world’s largest oil and gas producer.
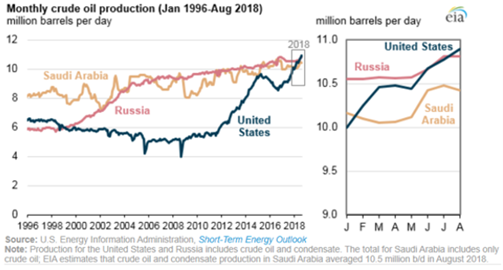
Figure 5. U.S. becomes largest global oil producer [5]
In addition, in 2018 the U.S. became the worlds’ fourth largest LNG exporter [4]. This is a starkly different outlook than reality in the U.S. energy supply 48 years ago. The U.S. Climate Alliance would like to see the energy mix be supplied with alternate resources. Is this a realistic expectation?
What are the Goal Posts & How Big is BIG?
In 2018, 85% of the energy consumed in the U.S. was hydrocarbon based. Roughly 1939 million tonnes of oil equivalent of US energy demand is hydrocarbon based – it should be noted that a tonne of oil is roughly equivalent to 6.84 barrels of oil. Thus, the hydrocarbon energy consumed is equivalent to 13,270 million barrels of oil.

So what does this mean? If you were to put this amount of oil in actual barrels and laid them end to end on the ground they would wrap the circumference of the earth 282 times!
It is a significant number. The U.S. electrical power generation in 2018 was roughly 4,460 terawatt hours [4]. This energy value converted into million barrels oil equivalent, is 2,490 million barrels of oil, or roughly 18% of the total 2018 U.S. energy consumption4. Thus, converting all electrical power generation to renewable energy would not be sufficient to achieve the stated green house emission goals. Further cuts would be required in energy consumption.
The question becomes if not hydrocarbons, then what else? Is renewable energy a realistic alternative?
The Elephant in the Room – How Will We Get There?
It is interesting that the European Union and the U.S. are taking two different approaches in attempting to solve the carbon crisis. In Europe, they are investing in research looking at what the alternatives are and developing new technologies. In addition, they are attempting to assess the various energy economy change cost implications [6, 7]. In the U.S., individual states are attempting to implement their own regulations. This Tip of the Month is only going to focus on the Renewable electric power generation options. Part 2 will focus on the other topics listed below.
The possible options are listed below:
► Increase in renewables
► Hydrogenation of the gas grid
► CCS (Carbon Capture and Sequestration)
► Gas displacing coal and oil (power gen and transportation)
► New technology??? What are those options?
Increase in Renewables – How Do They Stack Up? Energy Parity with Oil
There has been a significant push in the U.S. to invest in renewables, and many Americans have the misconception that our energy needs with our current living standards can be meet with wind turbines and solar.
Onshore Wind Turbines
Assuming a typical onshore wind turbine with a 3 MegaWatt (MW) capacity and 40% efficiency (on the high end), that turbine would produce a net equivalent of 17 barrels of oil per day. Note the Betz Limit is the physics boundary for a wind turbine, the maximum efficiency a turbine could capture is roughly 60% of the kinetic energy from wind) [8]. This calculation assumes 1 bbl of oil is equivalent to 1.7 MW of energy, which is a typical value for a 22 API crude. Assuming the wind blew 24 hours a day (overly optimistic), said wind turbine would produce 17 bbls oil per day. See conversion and Figure 6 below.

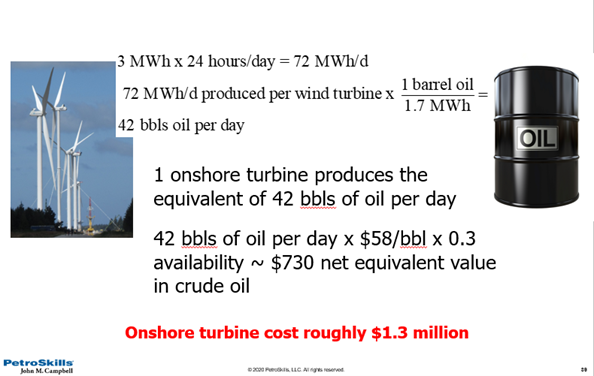
Figure 6. Onshore Wind Turbine Energy Parity Comparison – Production Per Day
Considering a rough installed cost of $1.3 million dollars. Some say that averaged over a years period solar and wind only provide energy 25 – 30% of the time. In todays dollars, the maximum net revenue produced by the wind turbine would be 17 bbl x $58 per bbl x 0.30 availability ~ $300 per day energy equivalent generation to crude oil. In comparison, the cost to drill a single shale well, that could produce 10 bbls of oil per hour, averaged over a decade, there is no comparison between the energy density between the two options. The differences in the rate of return and energy production is significant.
Offshore Wind Turbines
Offshore wind turbines are incredibly expensive given the technology and the investment to build them and bring the high power transmission lines via sub-sea. Assuming a typical offshore wind turbine with a 8 MW capacity, a 40% efficiency, and that the wind blew 24 hours a day, that turbine would produce a net equivalent of 45 barrels of oil per day. Wind turbines do not have 100% availability factors. See conversion below and Figure 7 below.

In 2014 offshore wind turbine cost have been estimated to be in the range of $2.8 million dollars per MW [9]. We can use this number as a rough example. For an 8 MW turbine, the installed costs would be $19 million dollars. Again, assuming 30% availability, the equivalent energy produced for that investment would be in the range of $780 per day. That investment would never payout unless the cost of the energy were to increase significantly.
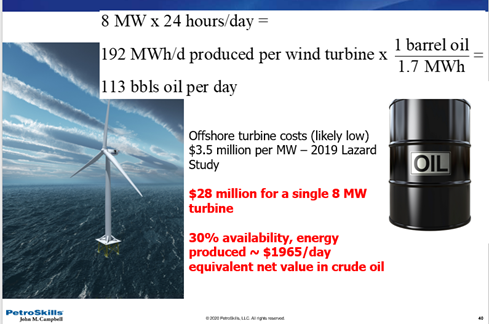
Figure 7. Offshore Wind Turbine Energy Parity Comparison – Production Per Day
Solar
Solar power is hard to give a definitive energy parity conversion to, as it is strongly dependent upon where the panels are installed and what the average radiation levels are at that location. Assuming a square meter panel has a 1000 kWh/year generation per square meter and a 26% efficiency (typical), it will generate roughly 710 Wh per day [10]. It should be noted that the physical limit of PV efficiency is the Shockley Queisser Limit which is 34% [8]. See conversion below:
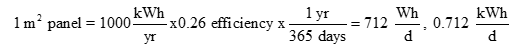
Solar is by far the least cost effective nor efficient way to generate baseload energy requirements. It would take 10 000 square meters, 107,640 ft2 of solar panels to produce the energy equivalency of 4.2 bbls of oil per day. Note that surface area required is equivalent to roughly 2.5 football fields. See Figure 8 and conversion below:
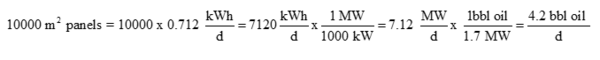
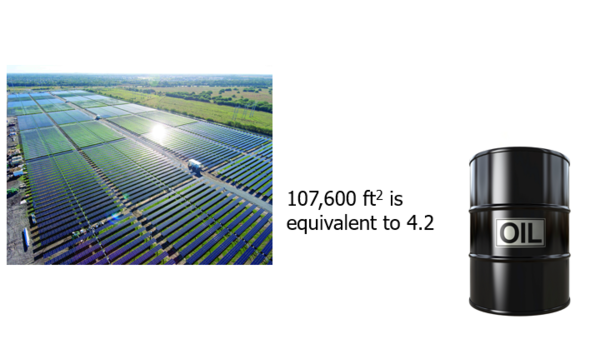
Figure 8. Energy parity of solar to crude oil
Given these parity values, it should be very clear that there is a limit to which renewables can displace hydrocarbons out of energy use alone.
For example, if one were to invest in $1 million dollars of each technology would produce the following kWh over a 30-year operating period [11].
Table 1. Hydrocarbon versus Renewable Investment Comparison [11]
The shale well produces roughly 600% more electricity for the same capital spent. The huge disparity is a direct result in the differences in energy density of the technologies.
LCOE Comparisons – Beware of False Prophets
There have been a number of studies that show the cost of renewable energy is falling rapidly. The levelized cost of energy (LCOE) is an economic assessment of the average total cost to build and operate a power-generating asset over its lifetime divided by the total energy output of the asset over that lifetime. One can think of this as the average minimum price at which electricity must be sold in order to break even over the lifetime of the project. These cost comparisons due not include the cost of transmission system modifications, battery power back up or peak shaving gas engine generators to supply the grid during periods of intermittency.
The current prices of solar and PV appear to be approaching grid parity, i.e., they appear to be approaching the same costs as a natural gas turbine co-gen power facility. Refer to Figure 9.
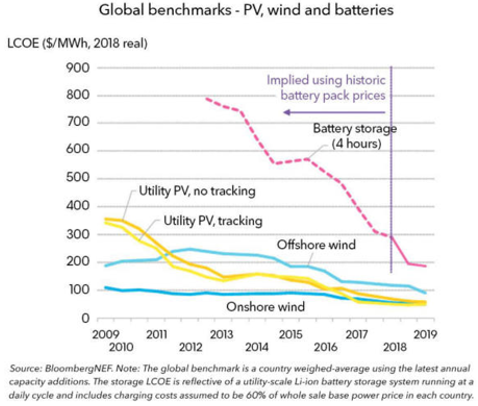
Figure 9. LCOE of Renewables [12]
U.S. Energy Information Agency (EIA) notes that the LCOE calculations are not applicable at renewable market penetration much above 15%. Why not? When the sun shines, power is available in surplus. It often has a negative value. This has already been experienced in two states, California and Texas.
California for example, is heavily invested in solar power. The grid operator increasingly must pay neighboring states to take the state’s excess solar electricity at a loss, and cut off power coming from solar farms, on sunny, low-demand days [13]. Despite too much installed capacity, the local building code requires all new residential construction to include solar panels, thus added an unnecessary $15 000 – $25 000 dollars to the cost of each home in an area where housing prices are already relatively high. In addition, California’s electricity prices between 2011 – 2018 increased 7 times more than the rest of the U.S..
Georgetown, Texas is a small municipality of 71,000 people, just north of Austin, Texas. In 2017 the mayor and town council decided to implement a “100% renewable” energy policy. Unfortunately, the residents of Georgetown are required to use Georgetown Utility Systems providing electricity, water, sewer, and garbage services. There are no other local alternatives. As a result, the cost of these services is not solely based on supply and demand, but are a strong function of the public policy.
To go “100% renewable”, the utility went into a 20 year, 144 MW-h supply contract with a wind turbine farm, and a 25 year, 150 MW-h contract with a solar plant. The contracted costs were higher than the average conventional generation electrical price. As a result, when the contracted power supply was in peak production, with excess capacity, the utility had to sell the excess energy production into the grid at reduced prices.
As a result, in 2018 their municipal utility was facing roughly $6.8 million shortfall from selling their excess contracted energy at a loss (energy prices are currently much lower than their 20 – 25 year term contracts). This money has to be made up by the city residents through higher electricity costs [14]. There are a number of lessons learned in the realities of the LCOE of renewables in both of these examples.
The “MYTH” of Battery Storage
Battery costs have been decreasing, but the technology is not cost effective in providing sufficient storage for large base-load demands. Wind and solar power generation cannot be dispatched when there is no wind, nor sunlight. Averaged over a year’s period, they can provide energy 25 – 30% of the time, and often less [15].
For example, let’s consider Tesla, the world’s most well-known battery manufacturer. To store the energy equivalent of energy of 1 barrel of oil in Tesla batteries would require $200 000 US in batteries, which will collectively weigh 20 000 lbs [4.5 tonnes] [8]. So, despite the fact that battery prices have fallen significantly, this technology is currently not practical nor affordable for baseload storage requirements. Even a 200% improvement in battery economics will not get us to parity in terms of oil storage energy equivalence. One barrel of 22 API oil would weigh roughly 322 lbm [146 kg] and can be stored in a $20 US tank [8].
The other dirty secret of batteries is that their production leaves a massive carbon footprint where they are produced. Most batteries come from China, Thailand, Germany, and Poland that rely on non-renewable energy sources like coal for electricity. To put this into perspective, making a 500 kg battery for a sport utility vehicle will emit 74% more CO2 than making a car with internal combustion. The average German car owner could drive a gasoline vehicle for three and a half years before a Nissan Leaf with a 30 kWh battery would beat it on carbon emissions [16]. This doesn’t include the energy it took to mine the lithium, the environmental damage from the mines themselves or the battery disposal issues.
The Other “Hidden Costs”
Changing the role of the grids existing coal fired power plants or gas turbine combined cycle plants with very high availability when operating on full load from primary to backup for wind/solar have other costs that emerge due to physical realities.
You cannot quickly turn off and on coal power gen or GTCC plants – capital costs increase efficiency decreases, in addition, cycling the plants increase wear and tear and increase maintenance costs.
In locations with a large portion of the local power supply generated from renewable energy will require flexible power generation to provide for the demand when it is inadequate or zero electricity being supplied from the renewable sources.
Now the U.S. grid has over $4 billion dollars of investment in utility scale engine drive gas generators, technology similar to those used to propel cruise ships. Most of these installations are natural gas driven, but some are fired on oil[8]. Reciprocating gas engine generators are much more flexible and have faster startup and shutdown times as compared to traditional power plant technology. For utility electricity power peaking applications, they are generally in the 20-300 MW output range[17]. These “hidden” costs are not accounted for in the LCOE energy comparisons as presented in numerous studies, again giving a false perception that renewables can replace hydrocarbons easily.
Are There Any Other Alternatives?
This Tip of the Month focused on renewables and how they may or may not fit in the U.S. power generation market. Part 2 of this Tip of the Month will focus on other technologies that may help the world achieve net greenhouse reductions while still maintaining the quality of life that we have come to expect.
To learn more about the global natural gas economy, we suggest attending our G2 (Overview of Gas Processing).
By: Kindra Snow-McGregor
References
1. Italy imposes offshore exploration moratorium, Petroleum Economist, 26 March 2019.
2. Why the Dutch lost their faith in natural gas – and what that means for the rest of the world, Gas Transitions, 13 February 2019.
3. United States Climate Alliance, 2018 Strategy
4. BP Statistical Review of World Energy 2019, 68th Edition
5. U.S. Energy Information Agency, Short Term Energy Outlook 2018
6. Why the Dutch lost their faith in natural gas – and what that means for the rest of the world, Gas Transitions, 13 February 2019.
7. Electrons or Molecules? We need shared parenting, Gas Transitions, 20 February 2019.
8. The New Energy Economy: An Exercise in Magical Thinking, Manhattan Institute, Report March 2019.
9. Offshore Wind Project Cost Outlook 2014, Clean Energy Pipeline
10. https://www.linkedin.com/pulse/my-17-quadrillion-plan-replace-oil-solar-power-allan-chatenay/
11. Lazard, “Lazard’s Levelized Cost of Energy Analysis, 2018, Gulfport Energy Credit Suisse Energy Summit, 2019, Cabot Oil & Gas, Heikkihen Energy Conference, Aug 15 2018.
12. Battery Power’s Latest Plunge in Costs Threatens Coal, Gas, March 26 2019, BloombergNEF
13. Why Renewables Can’t Save the Climate, M. Shellenberger, Forbers, Sept 9, 2019.
14. Texas Tax Payers Pay for Political Virtue Signaling with Costly Renewable Energy, C. Devore, Forbes, Dec 17, 2019.
15. Landon Stevens, The Footprint of Energy: Land Use of U.S. Electricity Production, Strata, June 2017.
16. Lithium Batteries’ Dirty Secret: Manufacturing Them Leaves Massive Carbon Footprint, Niclas Rolander, Jesper Starn, and Elisabeth Behrmann, Bloomberg, 16 October 2018.
17. Reciprocating Engine Generator Technology, Issue 6 Vol 121, June 9, 2017.