Thermodynamic Hydrate Inhibitors – How Do They Compare?
Part 3. Pipeline Water Wet Condensate Case Study
Currently, there are several different thermodynamic hydrate inhibitors that one has available to choose from. One could choose to use an oxygenate, such as methanol, or a glycol, such as mono-ethylene glycol (MEG) or diethylene glycol (DEG). But what determines the inhibitors hydrate suppression performance, and which one should I choose for my inhibition needs? The primary considerations for an application include:
- Hydrate Suppression Effectiveness
- Inhibitor Regeneration Requirements
- Inhibitor Losses / Product Contamination
- Inhibitor Cost
Hydrate Suppression Effectiveness
The lower the molecular weight of a thermodynamic inhibitor, the better the hydrate suppression performance. For example, in glycols MEG has better performance characteristics than DEG, and methanol MeOH will outperform ethanol EtOH. In Part 1 of this tip of the month (November 2020 TOTM [1]) provided insight into the relative performance of hydrate inhibitors, and discussed the limitations, pros and cons of the various options. Part 1 demonstrated that for a hydrate depression temperature of 10oC (18oF) to prevent hydrates formation in our gathering system the required concentration of inhibitor in the liquid water phase using the Nielsen and Bucklin [2] equation is 13 mole %. Figure 1 provides the corresponding weight % of the various inhibitors that would be required for this depression temperature (d). As shown in Figure 1, the inhibitors weight % is a function of molecular weight shown on the horizontal axes.

Figure 1. Comparison of Inhibitor Requirements in Liquid Water Phase for Depression Temperature of 10oC (18oF)
In this TOTM we will revisit the Case Study of December 2020 TOTM [3] in the application and selection of inhibitor for a gathering system inhibition application. For the same Case Study, we will include the entrained water in the hydrocarbon condensate entering the pipeline.
Revised Case Study
To prepare a hydrate prevention program for the subsea pipeline, let us consider a multiphase subsea pipeline transporting gas and condensate from an offshore production facility to shore. The flow rates and pipeline conditions are provided in Table 1 and Figure 2. The feed condensate to pipeline water-cut is 0.2 volume percent. The solubility of methanol to the hydrocarbon liquid phase is a strong function of both the water phase concentration of inhibitor, but also the hydrocarbon phase composition. The previous case study assumed that the condensate that was separated on the platform was bone-dry when it was pumped into the pipeline with the gas phase. This tip of the month is going to focus on the impact of water-cut in the condensate on the inhibitor injection rates. As with the previous case study, for the methanol injection estimates, we will include both the vapor and liquid hydrocarbon losses.
Table 1. Flow rates and pipeline conditions


igure 2. Schematic of subsea pipeline
To determine the impact of the water-cut of the condensate on the inhibitor injection requirement, one needs to calculate the mass of additional water this adds to the pipeline. The additional water is estimated as follows:
- Liquid water rate = (water-cut fraction, W-Cx) (condensate flow rate, qc) (fresh-water density, ρwater)
- Liquid water rate = (0.2 /100) (90 m3/d) (1000 kg/m3) =180 kg/d
- Liquid water rate = (0.2 /100) (566 bbl/d) (5.615 ft3/bbl) (62.4 lbm/ft3) =397 lbm/d
The water content of lean sweet natural gas is a function of temperature and pressure and can be estimated from the charts in chapter 6 of volume 1 of Gas Conditioning and Processing [4]. The water content of the gas at the inlet and outlet of pipeline are used to the determine the amount of condensed water in the. The liquid water associated with watercut should be added to the condensed water. The total liquid water is a first key factor that establishes the amount of hydrate inhibitor required. Likewise, the hydrate formation temperature (HFT) is a function of pressure and relative density of gas and can be estimated from the chart in reference [4]. The second key factor is the required depression temperature (d=HFT-Tcold). The HFT is an important parameter for determination of the depression temperature. The summary of preliminary calculation results is presented in Table 2.
Table 2. Summary of preliminary calculation results

The hydrate inhibitor performance plots that are presented in this tip were developed using the Nielsen and Bucklin [2] correlation presented as equation 1.
(1)
 (1)
(1)Where: d = depression f hydrate point. °C (°F in FPS)
xm = mole fraction inhibitor in the liquid water phase
A = constant, -72 (129.6 in FPS)
The third key factor is the required inhibitor weight % in the liquid water phase, XR. From Figure 3 for depression temperature. d = 12.1 °C (22 °F), XR for MeOH, MEG and DEG are determined and shown in Table 3. The inhibitor concentration in the same phase for all three inhibitors is XR = 15.6 mole %.

Figure 3. Depression temperature vs mole % and weight % hydrate inhibitor in the liquid water phase for Typical Gathering Systems
From Figure 4 for depression temperature, d = 12.1 °C (22 °F), the required ratio of mass of inhibitor in the liquid water phase to mass of condensed water, (mI / mW) for three inhibitors are determined and shown in Table 3. The required inhibitor rate in liquid water phase, mI, the fourth key factor, can be calculated by equation 2.
Where:

From Figure 4 at the same depression temperature, the required mass ratio, (mI / mW), for lean MeOH 100 %, MEG 100 wt% and DEG 100 wt%, are 0.33%, 0.63% and 1.08, respectively; and for MEG 80 wt% and DEG 80 wt%, are 0.96% and 1.86, respectively.
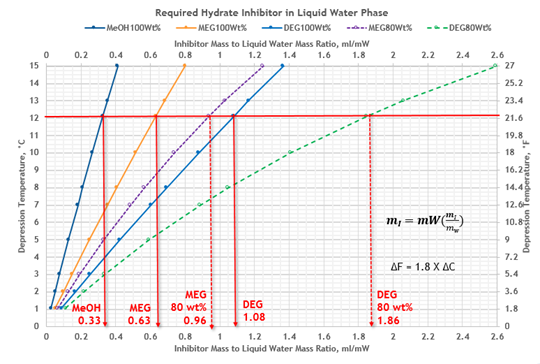
Figure 4. Depression temperature vs ratio of mass of inhibitor to mass of condensed water, mI/mW
The summary of the required inhibitors rate calculations for liquid water phase are presented in Table 3.
Table 3. Summary of required inhibitors injection rate for liquid water phase

Figure 5 and Table 3 present comparison of inhibitors to liquid-water mass ratio, (mI / mW), requirements for MeOH, MEG and DEG at various lean inhibitor weight %. Figure 5 indicates that methanol with MW=32 is the most effective because of its lowest mass ratio requiring the lowest inhibitor mass rate while DEG with MW = 106 is the least effective because its largest mass ratio requiring the most inhibitor mass rate.

Figure 5. Comparison of inhibitors to liquid water mass ratio, (mI / mW)
MeOH Losses to Liquid and Vapor Hydrocarbon Phase
Due to low vapor pressure and low solubility in liquid hydrocarbons, glycol losses to vapor and liquid hydrocarbon phases are negligible, and we will assume these to be zero. However, MeOH losses to vapor and liquid hydrocarbon phases are significant and estimated in this tip.
The MeOH losses to liquid hydrocarbon phase can be estimated by our proposed Figure 6 and equation 3.

Where: mLF = MeOH loss factor from Figure 6,
kg MeOH/m3 (lbm MeOH/bbl condensate in FPS)
qL = condensate rate, m3/d (bbl/d in FPS)
ɣ = condensate relative density
MW = condensate molecular weight
From Figure 6 for depression temperature, d = 12.1 °C (22 °F), the required MeOH loss factor is 0.44 kg/m3 (0.154 lbm/bbl). For a condensate rate of 90 m3/d (566 bbl/d), relative density of ɣ = 0.59 and molecular weight of MW = 55, calculate rate of MeOH loss to liquid hydrocarbon phase by equation 3.


Figure 6. MeOH loss factor to liquid hydrocarbon phase
The MeOH losses to vapor hydrocarbon phase can be estimated by our proposed equation 4 and Figure 7 [4].

Where: K = MeOH vapor-liquid equilibrium ratio
qS = gas rate, std m3/d (scfd in FPS)
x = MeOH mole fraction in liquid water phase
A = conversion factor, 1.35x10⁶ (84 300 in FPs)
From Figure 7 for cold temperature of 4.4 °C (40 °F) and pressure of 6.2 MPa (900 psia) the K value is 0.0019. For agas rate of 1.4125 x 10⁶ std m3/d (50 MMscfd) and MeOH mole fraction of x=0.156, calculate rate of MeOH losses to vapor hydrocarbon phase by equation 4.
(kg MeOH/d) = 1.35x10⁶ (1.4125) (0.0019) (0.156) = 565 kg/d
(lbm MeOH/d) = 84 300 (50) (0.0019) (0.156) = 1250 lbm/d

Figure 7. MeOH K-value in natural gas
The total required inhibitors injection rate to prevent hydrate formation is calculated by equation 5.
mT = mI + mLHC + mVHC (5)
Where: mT = total required inhibitor rate
mI = required inhibitor rate in liquid water, this is the inhibitor amount that prevents hydrate formation
mLHC = inhibitor rate loss to liquid hydrocarbon phase
mVHC = inhibitor rate loss to vapor hydrocarbon phase
Table 4 presents summary of total required inhibitors injection rate to prevent hydrate formation. Figure 8 also presents comparison of water phase inhibitor rate compared (blue bars) to total required inhibitors injection rate (red bars) to prevent hydrate formation.
Table 4. Summary of total required inhibitors injection rate to prevent hydrate formation.

The inhibitors injection rate in parentheses are for the case of excluding condensate entrained liquid water.
Table 4 and Figure 9 indicate that including the (0.2 vol% watercut) entrained water increases the inhibitor injection rates by 6.7 % for MeOH and 20% for MEG and DEG.

Figure 8 - Comparison of total required inhibitors injection rate to prevent hydrate formation for wet (water-cut 0.2 vol%) and bone-dry (water-cut 0.0 vol%) condensate.

Figure 9 - Comparison of total required inhibitors injection ratio to prevent hydrate formation for wet (water-cut 0.2 vol%) and bone-dry (water-cut 0.0 vol%) condensate.
Despite MeOH excellent performance in terms of hydrate suppression, its biggest downfall is its distribution behavior. As shown in Table 4 and Figure 8, methanol was distributed in all three phases of liquid water, vapor and liquid hydrocarbon phases.
In fact, the losses are significantly greater than the rate required in the water phase which results in higher injection rates required as compared to MEG and DEG. For our Case Study the sum of MeOH losses to the vapor and liquid hydrocarbon phases is about 1.6 to two times greater than the required rate of inhibitor in the liquid water phase. The amount of MeOH losses to the vapor phase is a function of pressure, temperature, and mole fraction of MeOH in the liquid water phase. But the amount of MeOH losses to the condensate phase is a function of temperature, mole fraction of MeOH in the liquid water phase, condensate relative density, molecular weight, and concentration of aromatic hydrocarbons. Note that mole fraction of MeOH in the liquid water phase is a function of the required depression temperature.
Once you inject methanol into the pipeline, it distributes to all phases: it is in the gas, the total amount of water (condensed and entrained), and the condensate. This is becoming a significant issue recently. Too much MeOH in the produced water can kill the microbes in the produced water treatment system (and it is toxic to fish so produced water offshore could not go overboard). In addition, MeOH is a petrochemical catalyst poison. Many North American natural gas, y-grade (NGL), and liquid products pipeline tariffs are specifying a maximum oxygenate concentration – or specifying ZERO! In addition, the methanol in the natural gas will slowly kill your very expensive 4A molecular sieve dehydration bed over time if the natural gas is being processed in an expander plant.
Glycols on the other hand have very low vapor pressure, with minimal losses in the vapor phase. In addition, there is very little mutual solubility with liquid hydrocarbons, so the injected glycol remains in the phase that you want it to be in, the water phase. The difficulty of using glycols is that the producer / owner operator needs to own the equipment on both ends of the pipeline so that the glycol can be separated in the plant inlet slug-catcher and inlet separators, so that it can be regenerated and either shipped, trucked or pumped back to the injection points in the gathering system.
Inhibitor Cost
Methanol is cheap in comparison to glycols. As a rough rule of thumb, glycols are roughly three times the cost of methanol. That is why glycols are nearly always regenerated. You only need to invest in the initial chemical costs once. However, methanol is cheap, but you will need to continually buy the amount of chemical you are injecting as it goes down stream and is not recovered.
Summary
This TOTM reviewed a Case Study in the application and selection of inhibitor for a feed gas with water wet condensate in a gathering system inhibition application. The contribution of entrained water in condensate to the inhibitor were considered. Table 4 and Figure 9 indicate that including the (0.2 vol% water-cut) entrained water increases the inhibitor injection rates by 6.7 % for MeOH and 20% for MEG and DEG. If the entrained water in the condensate is not taken into account for the inhibitor injection rates, then there is a strong possibility that hydrates may form in the pipeline because there is insufficient inhibitor present in the water phase. In addition, the pro’s and con’s of oxygenates versus glycols was discussed in more detail.
To learn more about similar cases and how to minimize operational problems, we suggest attending our G4 (Gas Conditioning and Processing), G5 (Practical Computer Simulation, and Applications in Gas Processing) courses.
By: Kindra Snow-McGregor, P.E., and Mahmood Moshfeghian, Ph.D.
References:
- Snow–McGregor, K., and Moshfeghian, M. “Thermodynamic Hydrate Inhibitors – How Do They Compare? Part 1: General Considerations,” PetroSkills -John M. Campbell Tip of the Month, November 2020.
- Nielsen, R.B., and R.W. Bucklin, “Why not Use Methanol for Hydrate Control?”, Hyd. Proc., Vol. 62, No. 4 (Apr. 1983), p. 71.
- Snow–McGregor, K., and Moshfeghian, M. “Thermodynamic Hydrate Inhibitors – How Do They Compare? Part 2: Case Study,” PetroSkills -John M. Campbell Tip of the Month, December 2020.
- Campbell, J.M., “Gas Conditioning and Processing, Volume 1: The Fundamentals,” 9th Edition, 3rd Printing, Editors Hubbard, R. and Snow–McGregor, K., Campbell Petroleum Series, Norman, Oklahoma, PetroSkills 2018