In 2017, approximately 31% of all the gas consumed worldwide was transported internationally. About 65% of this gas was transported via pipeline (21% of the total) and approximately 35% was transported as liquified natural gas (LNG) (10% of the total) [1].
Most of the gas transported internationally by pipeline was from Russia and Norway to Western Europe and from Canada to the US. The largest LNG importing region was in the Pacific Basin, mainly Japan and South Korea. Most of this LNG was supplied from the Middle East, Australia, Indonesia and Malaysia.
As shown in Figure 1, LNG is often the first choice for large volumes of natural gas transportation when the distances are large and when the supplier and buyer are separated by an ocean.
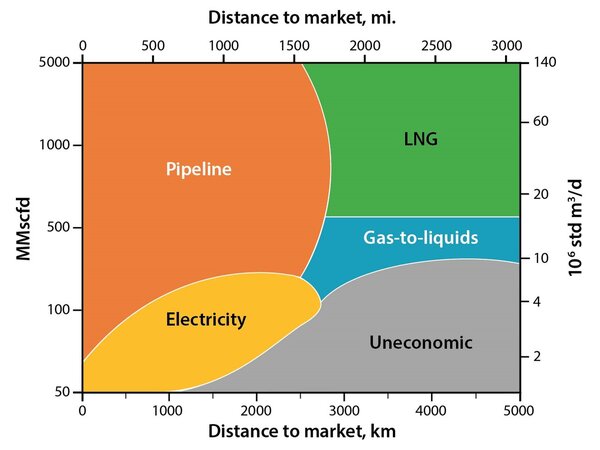
Figure 1. Natural gas transportation options
Figure 2 shows the overall transportation efficiency for natural gas [2]. Notice, LNG efficiency is roughly 90%. This is related to about 10 % fuel consumption for liquefaction and transportation. Notice the steep curve of the pipeline systems going from 100% efficiency at 0 distances to roughly 65% efficiency at 8000 km (4971 mile). This is essentially the fuel gas requirements for the compression along the length of the pipeline.
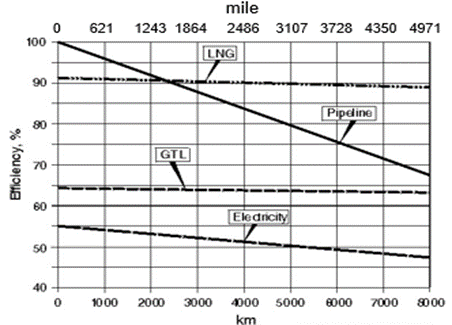
Figure 2. Nominal natural gas transportation efficiency [2]
The LNG is typically stored in insulated tanks to keep it in a liquid state for longer periods. As a result of heat transfer from surroundings to the storage tank a portion of the LNG may evaporate which is known as boil-off gas (BOG). In addition to the heat transfer, reference [3] discusses other sources or mechanisms of BOG like:
1. The sloshing of cargo: Liquid Motion
2. The cooling of tanks
3. LNG loading and unloading conditions
4. Cargo tanks pressure decrease
If the BOG gas is not removed from the storage tank, the tank pressure increases. The tank is designed, however, to withstand higher pressure; typical design pressure is 29 kPag (4.2 psig) and design temperature of -170 °C (-274 °F). For handling pressure build up in the LNG tanks reference [4] purposes the following alternatives for offshore:
1. Adequate tank design pressure
2. Re-liquefaction
3. Thermal oxidation i.e. combustion of the BOG gas via a burner system
4. Compression
5. Fuel sharing i.e. diesel + BOG combusted in a dual-fuel burner system
The description of the above alternatives is presented in reference [4]. As an example, the description of the fuel sharing is extracted and presented here.
“In order to match BOG generation with engine consumption for a desired load, fuel sharing can be utilized. Dual-fuel engines are capable of running on both diesel and gas, which can be used to even-out variations in gas supply or quality. With normal gas operation, around 1—5% of the pilot fuel is needed to ignite the gas. With fuel sharing, the amount of gas can be varied between around 15% and 85%, with the rest being diesel [4].”
As shown in Figure 3, reference [4] also presents a simplified system layout for BOG handling, when using two-stroke main engines and four-stroke auxiliary engines. The ideal consumption should match boil off rate (BOR), resulting in a BOG balance of zero. This is similar to a vapor recovery unit (VRU) used for hydrocarbon condensate and crude oil storage tanks.
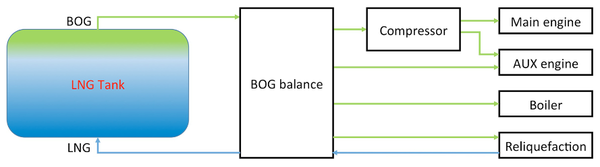
Figure 3. Block diagram for BOG handling on an LNG carrier ship [4]
In continuing the August and October 2019 tips-of-the-month (TOTMs) [5, 6], this study was undertaken to investigate the composition and Wobbe Index (WI) of the BOG in an LNG carrier ship. The BOG composition and its WI are useful for fuel sharing. A daily BOR of 0.15 % of total LNG storage volume for an example lean/light LNG mixture containing nitrogen (1%), methane (96%), ethane (2%), and propane (1%), on the mole basis was considered. The compositions of each component in the LNG and the BOG were determined by performing two series of bubblepoint calculations: one at a specified pressure of 108 kPa (15.7 psia), another at specified temperature of -162 °C (-259.6 °F) and the resulting BOG and LNG composition in the storage tank. The calculations involved the vapor-liquid equilibria (VLE) and the component material balances. The UniSim Design program [7] and its Peng-Robinson equation of state option for thermodynamic package were used to perform the bubblepoint calculations.
Method 1: BOG at Constant Pressure 108 kPa (15.7 psia)
Based on the following specified data and assumptions, a detailed step-by-step VLE and material balance calculations were performed over a 10-day period.
- Step-time, one day
- LNG storage capacity, 170,000 m3 (6,004,372 ft3)
- Insulated LNG storage tank
- BOR, 0.15 vol % per day based on the total initial LNG volume
- LNG density during a step-time is constant
- BOG composition during a step-time is constant
- Initial LNG composition, mole %: N2=1; C1 =96; C2 =2; C3 =1
The mole fractions of each component in the BOG and remaining in the storage LNG tank, bubblepoint temperature, and the BOG WI were calculated and are presented graphically in the following sections.
Figures 4 and 5 present the mole fractions of CH4 and N2 in the BOG and in the remaining LNG as a function of the voyage days. Notice the N2 mole fraction in BOG varies from about 0.22 to 0.167 and is considerable; typically, the upper limit is 0.20.
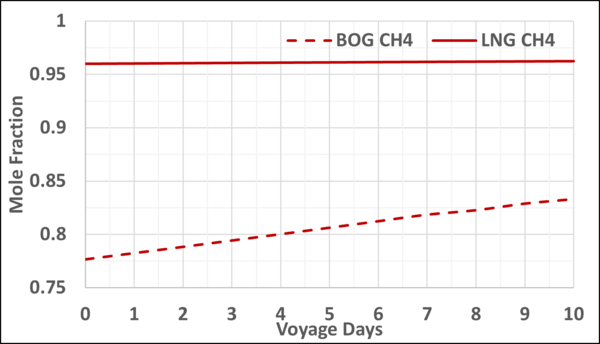
Figure 4. Variation of CH4 mole fraction in the LNG and BOG with the voyage days
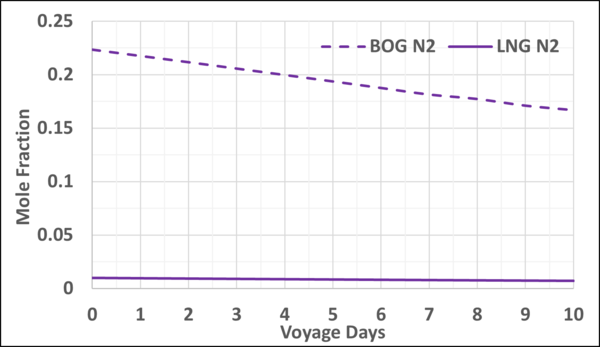
Figure 5. Variation of N2 mole fraction in the LNG and BOG with the voyage days
Figure 6 presents the WI of the BOG as a function of the voyage days. The WI typical values are 45 to 52 MJ/std m3 (1200 to 1400 Btu/scf). Therefore, this BOG may be blended with a higher energy content fuel to meet the required WI specifications. More detail can be found in reference [4].
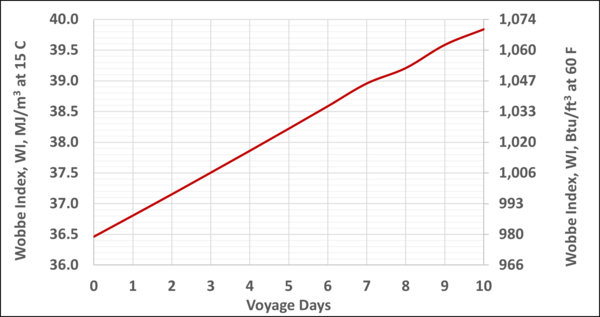
Figure 6. Variation of the WI of BOG with the voyage days
The variation of bubblepoint temperature of the storage tank LNG at constant pressure of 108 kPa (15.7 psia) as a function of the voyage days is shown in Figure 7. Notice the bubblepoint temperature increases by about 0.8 °C (1.5 °F). Bubblepoint temperature is influenced by the light component concentration. As BOG production continues the mole fraction of N2 in the LNG decreases from 0.01 to 0.007 which makes the bubblepoint temperature increase slightly.
Figure 8 also presents the mole fractions of N2 and CH4 in the storage LNG and the BOG.
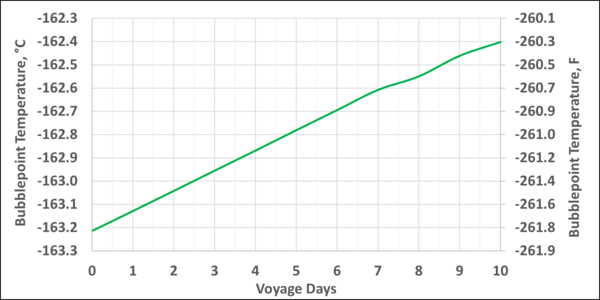
Figure 7. Variation of the storage tank temperature with the voyage days
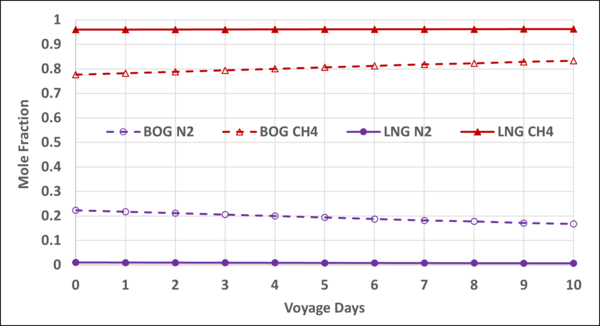
Figure 8. Variation of N2 and CH4 mole fractions in the LNG and BOG with the voyage days
Method 2: BOG at Constant Temperature -162 °C (-259.6 °F)
Based on the specified data and assumptions similar to the method 1, the VLE and material balance calculations were performed for the first 10-days of ship voyage. The simulation results include: the mole fractions and the amounts of each component in the BOG and in the remaining LNG, bubblepoint pressure, and the BOG WI. The results are presented graphically in Figures A1 through A5 of Appendix A.
Figure A4 in Appendix A indicates that at constant temperature, after 10 days of voyage the bubblepoint pressure reduces slightly by about 7 kPa, from 118.5 to 111.6 kPa (1 psia, from 17.2 to 16.2 psia). Over the full 10 days, the mole fraction of N2 in the LNG decreases from 0.01 to 0.007 which makes the bubblepoint pressure decrease slightly.
Figure 9 shows N2 mole % variation in the LNG and BOG when studied using the constant pressure and the constant temperature methods. The difference between the LNG N2 mole % using either method is small and the maximum difference between BOG N2 mole % is about 1 mole %.
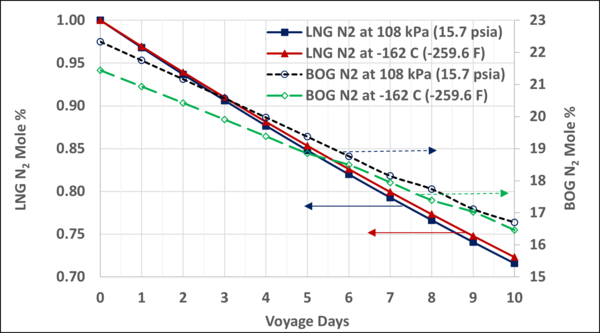
Figure 9. Variation of N2 mole % in the LNG and BOG; constant pressure BOG vs constant temperature BOG
Method 3: BOG at Constant Temperature -162 °C (-259.6 °F) for 1-Day Voyage (Validation)
To check the validity and accuracy of the step-time of one day, the step-time was reduced to 2.4 hours and calculations were completed for one day (10 step-time) of voyage. Based on the specified data and the other assumptions similar to the Case 2, the VLE and material balance calculations were performed for the 1-day of ship voyage. The simulation results including the mole fractions of each component in the BOG and in the remaining LNG, bubblepoint pressure and the BOG WI and are presented graphically in Figures B1 through B5 of Appendix B. Good agreements were obtained between the first day of 10-day voyage and step-time one day with the results of 1-day voyage and step-time of 2.4 hours. This confirms that the step-time of one day for these types of calculations is adequate and acceptable.
Summary:
The BOG on an LNG carrier ship can be used to run the ship’s engines, auxiliary engines or to generate steam. However, a good estimate of composition and the WI are needed for fuel sharing and to provide suitable engine fuel. Based on the work done in this TOTM, the following can be concluded:
- Depending on the N2 content in the LNG the WI of BOG-alone may not meet the requirements for the ship engines or the auxiliary engines. For the ten days voyage WI varied from about 36.5 to 39.8 MJ/std m3 (979 to 1069 Btu/scf), see Figures 6 and B3. BOG may be blended with a higher energy content fuel to meet the required WI specifications.
- Under the ideal conditions of the two BOG methods at constant pressure or constant temperature,
- The variation of cargo bubblepoint temperature/pressure was about 0.8 °C (1.5 °F) or about 7 kPa (1 psi), (Figures 7, B4 and C4).
- The difference between the LNG N2 mole % in both methods is small and the maximum difference between BOG N2 mole % in the two methods is about 1 mole % (Figure 9).
- BOG properties varied linearly as a function of the voyage days.
- The step-time of one day is adequate for performing VLE and material balances.
Modern membrane LNG carriers such as Q-flex (210,000 m3 LNG) and Q-max (266,000 m3 LNG) are designed for BOG recovery systems, using Hammworthy nitrogen-cycle re-liquefaction process. These modern carriers use MAN B&W 7S70 ME-C two-stroke low-speed diesel burning heavy fuel oil that is electronically controlled. This configuration avoids BOG losses in these modern carriers.
To learn more about similar cases and how to minimize operational problems, we suggest attending our G4 (Gas Conditioning and Processing), G5 (Practical Computer Simulation Applications in Gas Processing), G29 LNG (Short Course : Technology and the LNG Chain), and G4 LNG (Gas Conditioning and Processing-LNG Emphasis) courses.
By: Mahmood Moshfeghian, Ph.D.
References:
- BP Statistical Review of World Energy 2018
- AA Amos, Special Report International Gas Trade: Drive to Lower Transportation Costs.” Oil and Gas Journal Volume 98, Issue 20, Pages 62-67, 15 May 2000
- GTT (Gas Transportation Technigaz), Boil-off Clarifications, https://www.gtt.fr/en/media-center/gtt-inside/boil-off-clarifications, Jun 2019
- B. Nygard, “Boil-Off Gas handling onboard LNG fueled ships,” https://www.wartsila.com/twentyfour7/in-detail/boil-off-gas-handling-onboard-lng-fuelled-ships, June 2019
- KS McGregor and FE Ashford, “//blog/entry/00_totm/aug19-fac-a-primer-on-lng#.XWSVruNKjcc,” PetroSkills tip of the month, Aug 2019
- KS McGregor and FE Ashford, “//blog/entry/00_totm/oct19-fac-useful-lng-conversions#.XacteJJKjcc /,” PetroSkills tip of the month, Oct 2019
- UniSim Design R443, Build 19153, Honeywell International Inc., 2017
Appendix A
Method 2: BOG at Constant Temperature -162 °C (-259.6 °F)
- Step-time, one day
- LNG storage capacity, 170,000 m3 (6,004,372 ft3)
- Insulated LNG storage tank
- BOR, 0.15 Vol % per day based on the total initial LNG volume
- LNG density during a step-time is constant
- BOG composition during a step-time is constant
- Initial LNG composition, mole %: N2=1; C1 =96; C2 =2; C3 =1
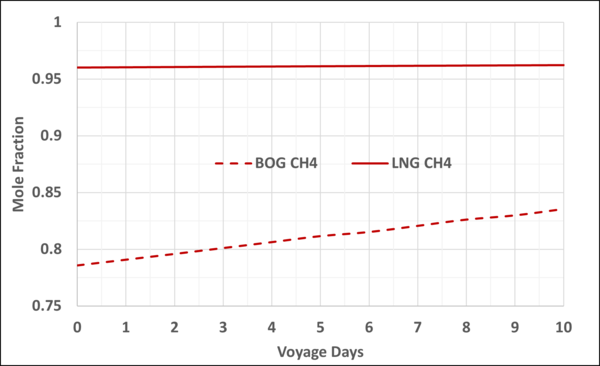
Figure A1. Variation of CH4 mole fraction in the LNG and BOG with the voyage days
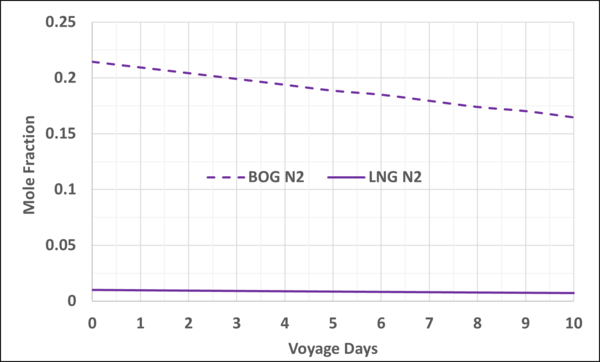
Figure A2. Variation of N2 mole fraction in the LNG and BOG with the voyage days
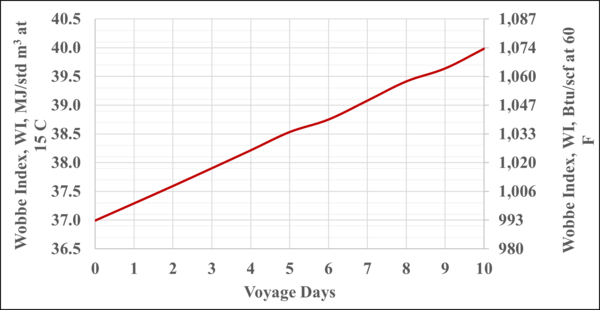
Figure A3. Variation of WI of BOG with the voyage days
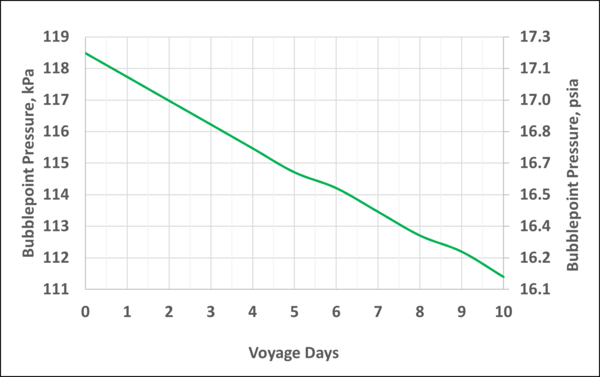
Figure A4. Variation of the storage tank pressure with the voyage days
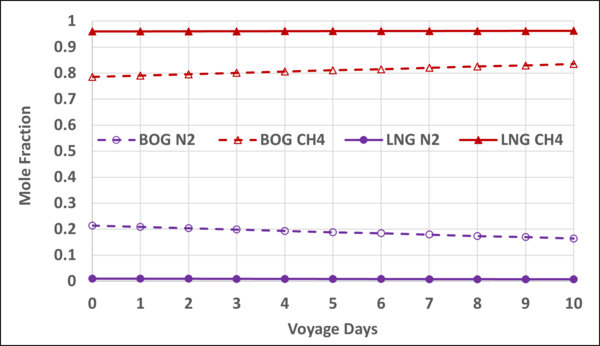
Figure A5. Variation of N2 and CH4 mole fractions in the LNG and BOG with the voyage days
Appendix B
Method 2: BOG at Constant Temperature -162 °C (-259.6 °F)
- Step-time, 2.4 hour
- LNG storage capacity, 170,000 m3 (6,004,372 ft3)
- Insulated LNG storage tank
- BOR, 0.15 Vol % per day based on the total initial LNG volume
- LNG density during a step-time is constant
- BOG composition during a step-time is constant
- Initial LNG composition, mole %: N2=1; C1 =96; C2 =2; C3 =1
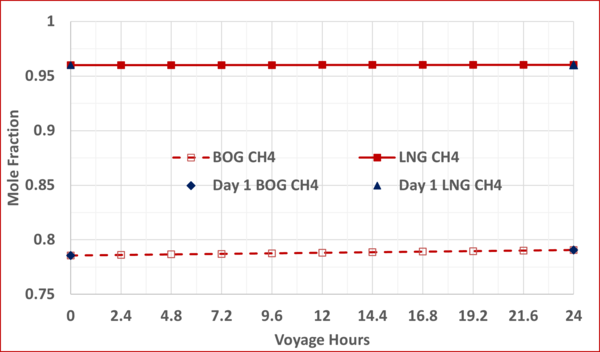
Figure B1. Variation of CH4 mole fractions in the LNG and BOG with the voyage hr; step-time of 24 hr vs step-time of 2.4 hr
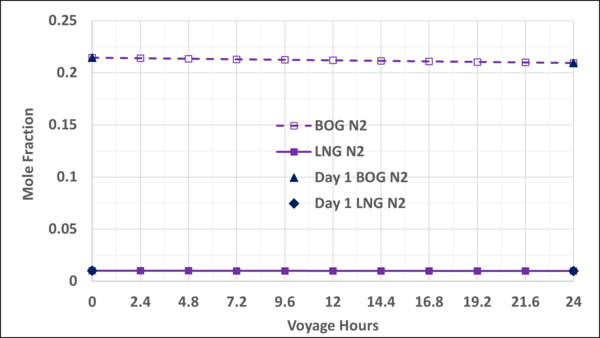
Figure B2. Variation of N2 mole fractions in the LNG and BOG with the voyage hr; step-time of 24 hr vs step-time of 2.4 hr
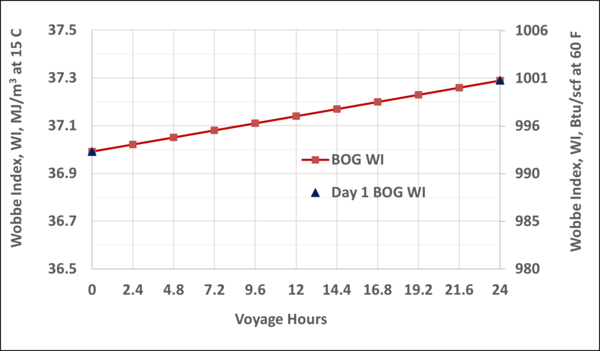
Figure B3. Variation of WI of BOG with the voyage hr; step-time of 24 hr vs step-time of 2.4 hr
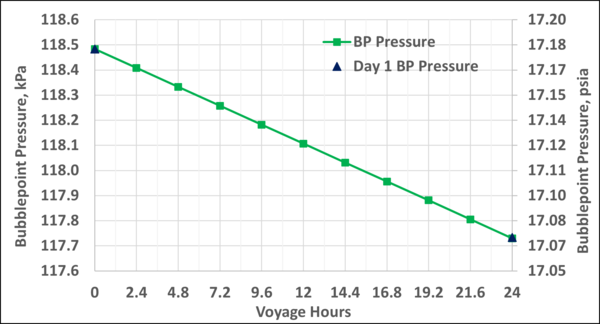
Figure B4. Variation of the storage tank pressure with the voyage hr; step-time of 24 hr vs step-time of 2.4 hr
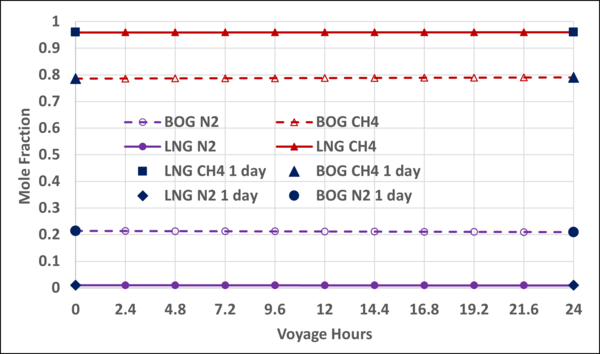
Figure B5. Variation of N2 and CH4 mole fractions in the LNG and BOG with the voyage hr; step-time of 24 hr vs step-time of 2.4 hr