Since the beginning of exploration for oil and gas we have seen exploration methods evolve, with the regular addition of new techniques. Also, exploration technology has improved continually over the decades, becoming increasingly sophisticated. But, despite these advancements, we should keep in mind that the art of looking for oil and gas involves the understanding that there is no substitute for the imaginative approach, and no such a thing as an “oil finder” or a "black box”.
Geology is a science that brings virtually every other scientific discipline to bear in its application, whether it is the sorting out of geologic events and processes or the exploration for important raw materials, such as oil and gas. The proper orchestration of other sciences to the performance of geologic application requires substantial skill as well as an analytic sense of imaginative investigation. Geology is not like mathematics, which produces results in absolute numbers. Geology uses mathematics and many other sciences, however, as adjuncts to the understanding of a large scenario comprising multiple components.
Petroleum exploration, as any other geologic investigation, uses all available parameters, and it is the duty of the explorationist to recognize the pertinent parameters as they are encountered. Without this important ability to recognize relevant parameters, the explorationist cannot function properly. Petroleum exploration is not the type of endeavor where all definitive factors are obvious at all times. The explorationist must use his or her personal experience as well as that of other team members to solve any problems encountered in the search for oil and gas. No information is discarded; the explorationist uses it all.
This article examines each of the below topics and how they pertain to petroleum exploration.
- Surface Geology
- Subsurface Geology
- Drilling Operations
- Electric, Radioactivity and Acoustic (Sonic) Logging
- Drill Stem Tests
- Geophysical Surveys
- Geochemical Surveys
- Maps and Cross-Sections
Surface Geology
Exploration techniques start with methods that involve the obvious: looking for petroleum or evidence of a working petroleum system at the earth’s surface. Field studies of rock outcrops can be conducted to locate and sample surface seeps of oil or gas, and to identify potential petroleum system elements, including source rocks, reservoir rocks and seal rocks, as well as evidence of potential traps. Certain more esoteric procedures, including aerial imagery (e.g. using drones), satellite imagery or geophysical and geochemical methods can produce sophisticated data indicative of oil and gas occurrences,. These methods are substantially more indirect and circumstantial than surface outcrop field studies. However, even the tactile and visual reality of an oil seep at a surface outcrop does not insure the occurrence of oil, in commercial quantities, in the subsurface.
Subsurface Geology
Large areas of the world have no outcrops or surface features or are located offshore. Surface geology is of little use in these places, which require subsurface analysis of whatever data are available.
Subsurface techniques use the same parameters as surface methods but do not have the benefit of continuity typical of surface exposures. For example, in the case of well data, we can sample, analyze and characterize subsurface rock formations at discrete geographic sites, that is, the well locations, but we must interpret the nature of the formation in the areas between the well locations. Subsurface data quality improves as the density of data increases. Interpretation of subsurface geology integrates data from a number of sources, the most common of which are well data and seismic data. Some sources, such as well data, provide direct information and others, such as seismic data, provide more indirect data.
Drilling Operations
Wells are drilled to explore for and produce petroleum. Drilling equipment has been developed by extensive experience throughout the long history of the petroleum business. It represents a complex and expensive technology that has evolved through operations all over the world in every conceivable environmental circumstance.
A standard onshore drilling rig consists of a derrick floor above a substructure that elevates it from the ground. The diesel engine-driven drawworks, cable and block systems and derrick are attached to the derrick floor (Figs. 1). A blowout preventer is installed below the derrick floor to control high-pressure zones and to prevent equipment damage during drilling operations.
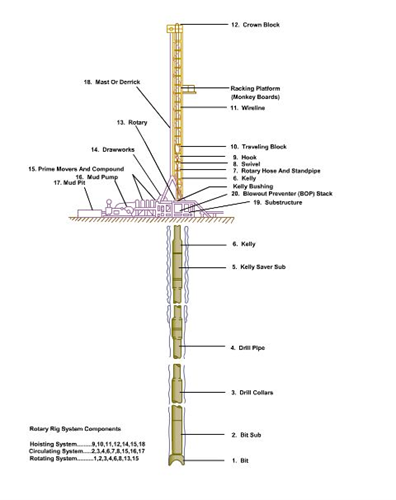
Figure 1 Rotary drilling system. From Fundamentals of Petroleum, 2nd ed., Copyright 1981, Petroleum Extension Service, The University of Texas at Austin (PETEX). Reprinted by permission.
Offshore drilling equipment is the same as that used onshore except that it is situated on a platform (Fig. 2), which may rest on the sea bottom (e.g. fixed steel jacket drilling plaform or jack-up rig) or be attached to a floating vessel (e.g. barge, drill ship or semi-submersible rig). Many platform types are designed to accommodate the drilling of multiple directional wells from a single location.
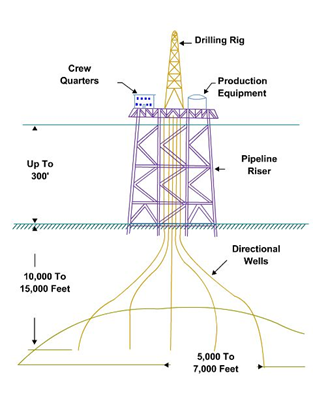
Figure 2 Drilling platform schematic. From Fundamentals of Petroleum, 2nd ed., Copyright 1981, Petroleum Extension Service, The University of Texas at Austin (PETEX). Re¬printed by permission.
Drill pipe, drill collars and a drill bit make up the drill string that is lowered into the ground to drill the well. In a standard rotary drilling system, power for turning the drill string is provided by the diesel engines through a chain drive that turns the rotary table, which turns the “Kelly” bar, which is connected to the top of the drill string . In recent years, as an alternative to the standard rotary table/Kelly drive system, many drilling rigs are equipped with a “top drive” unit, which is a mechanical device located at the swivel’s place, just below the traveling block. The top drive unit turns the drill string directly and provides for more efficient drilling operations.
During drilling operations, a specially prepared “drilling mud” is pumped from the mud tanks, through the standpipe, rotary hose, and swivel into the Kelly and the drillstring (Fig. 3). The mud passes through the drillstring and exits the jets in the bit. It cleans and conditions the well bore as it rises to the surface in the annulus between the drillstring and the walls of the well bore. As drilling progresses the drill string is extended by adding more lengths of drill pipe, and correspondingly, the amount of mud required to maintain the well bore is increased as the well depth increases.
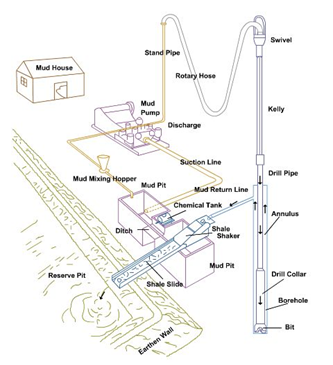
Figure 3 Mud circulation system. From Fundamentals of Petroleum, 2nd ed., Copyright 1981, Petroleum Extension Service, The University of Texas at Austin (PETEX). Reprinted by permission.
In addition to providing lubrication for the drill bit and transporting drill cuttings out of the hole, the drilling mud is also used as a control for high pressure formations encountered by the well at depth. If high pressure zones are anticipated or encountered, the weight of the mud is increased to control the formation pressure. Conversely, if low pressure or lost circulation zones are encountered, the mud weight is reduced.
During the drilling of a well, rock samples from the penetrated formations can be obtained in three ways:
- Drill cuttings carried to the surface by the circulating drilling mud
- Coring operations, whereby a special core bit is used to retrieve a cylindrical core sample from the bottom hole
- Wireline, whereby specially designed tools retrieve “sidewall core” samples from the borehole wall during well-logging operations
Electric, Radioactivity and Acoustic (Sonic) Logging
Once the borehole has been drilled, subsurface geological information can be obtained by wireline well logging techniques. Measurements are made of the electrical, radioactive and acoustic properties of rocks and their contained fluids encountered in the well bore. Several types of measurements produce information on formation rock acoustic velocity, density, radioactivity, conductivity and resistivity. From this data, rock lithology, formation depth and thickness, as well as formation porosity, fluid saturation and fluid type can be interpreted. Caliper logs are used to measure borehole diameter. Geologic maps and cross-sections are readily constructed from a variety of well log data and assist in understanding sedimentary facies distribution, as well as formation thickness and structural relationships. Such maps become the basis for defining the locations of future exploration and development drilling sites.
Logs are obtained by lowering a sonde or tool (Fig. 4) attached to a cable or wireline to the bottom of a well bore filled with drilling mud. Different types of logging tools with a variety of sensors are used to record a range of rock properties. From some tools, electrical, nuclear, or acoustic energy is sent into the rock and returns to the sonde for measurement. Other types of tools measure specific rock properties directly from the borehole wall, as the sonde moves past formation. The logging tools are continuously raised from the wellbore bottom at a specific rate as the measurements are recorded, and the well log is completed when the sonde arrives at the top of the interval to be investigated. Formation water saturation, porosity, permeability radioactivity and resistivity are rock properties that affect logging and the types of logs to be obtained.
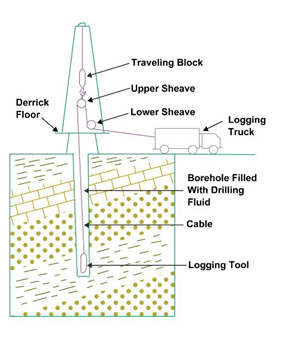
Figure 4 Electric logging schematic.
As a wellbore is drilled the rock formations and their contained fluids are penetrated by the bit and affected by the drilling process. Drilling mud invades the rock surrounding the wellbore, and this can affect the logging of the hole. A permeable, porous formation, which has been invaded by drilling mud during the drilling process develops parameters which influence logging tool response, and this must be considered in log data interpretation. Significant among these parameters, as portrayed on a generalized cross-section of the borehole environment (Fig. 5), from the center of the wellbore outward into the formation are: hole diameter; drilling mud ; mudcake; mud filtrate; flushed zone; invaded zone; and uninvaded zone.
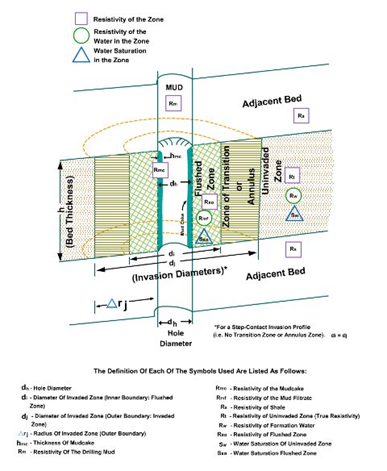
Figure 5 The borehole environment and symbols used in log interpretation. This schematic diagram illustrates an idealized version of what happens when fluids from the borehole invade the surrounding rock. Dotted lines indicate the cylindrical nature of the invasion. From Asquith, 1982. Permission to publish by AAPG.
Drill Stem Tests
Formation evaluation by obtaining formation pressure data as well as samples of formation fluids, including oil, gas and water is made possible by drill stem testing procedures. The testing equipment is lowered into the wellbore on the drill pipe and put into place by seating a packer that seals off the formation, isolating it and protecting it from contamination by drilling mud (Fig. 6). The tool is opened, and fluid samples and pressure data are obtained.
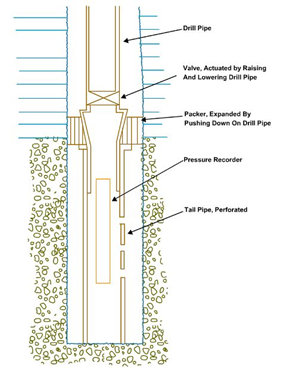
Figure 6 Drill-stem test tool. From Dickey, 1979. Permission to publish by PennWell Publishing Company.
Drill stem tests are run in wells where promising hydrocarbon shows are encountered in cores or drill cuttings samples, or where evidence of hydrocarbons is indicated by wireline log data. Segregation of the individual formations produces results from specific intervals.
Pressure data are evaluated to determine the productive potential of the formation being tested. These data and fluid information can facilitate decisions on how the well is to be completed: as a producing well or as a dry hole to be plugged and abandoned.
In a field development setting, the evaluation of drill stem test pressure and fluid data (Fig. 7) can be very helpful in understanding the connectivity and continuity of individual reservoir zones across the field area. Data similarities from well to well suggest the same reservoir. Dissimilar data are potentially indicative of separate reservoirs, permeability barriers, or contamination.
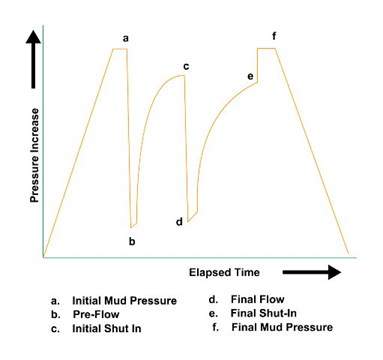
Figure 7 Drill-stem test pressure chart
Geophysical Surveys
Several types of common geophysical surveys are in use in petroleum exploration. They provide some direct and some indirect structural data for interpreting subsurface geology. In most instances, geophysical survey methods provide no direct indications of petroleum occurrences, although scientific advances in recent years have led to the development and rapid improvement of technology for the identification of so-called “direct hydrocabon indicators” or DHI’s, based on seismic data.
In gravity surveys, differences in the density of crustal rocks are measured by a gravimeter. Low density rocks are represented as negative anomalies and high density rocks as positive anomalies (Fig. 8). Gravity surveys are particularly useful in exploration of salt dome terrains. Salt domes have low density and appear as negative closed anomalies on gravity maps. Gravity surveys provide indirect structural and lithologic data.
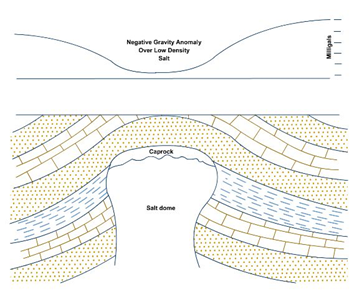
Figure 8 Salt dome gravity survey
Magnetic surveys utilize a magnetometer to measure variations in magnetic intensity. Basement rocks usually contain more magnetically susceptible iron-bearing minerals. So, for example, when basement rocks are deformed and raised as fault blocks they are placed closer to the ground surface and produce stronger magnetic values (Fig. 9). Such features appear as positive magnetic anomalies and indirectly indicate possible basement-related structure.
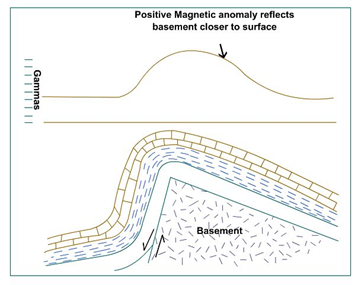
Figure 9 Magnetic survey over an anticline
Unfortunately, variations in the magnetic susceptibility of the basement can be a function of compositional differences. Therefore, a level basement surface consisting of a variety of rock types can produce apparent positive anomalies, which can be confused with structural deformation. To overcome these problems, modeling of magnetic data to produce plausible structural patterns is essential to interpretation. Magnetic surveys provide indirect structural and lithologic data sections.
Seismic surveys are the best and most definitive geophysical means of subsurface structural and stratigraphic representation currently in use. As described earlier, in special instances, seismic data can also sometimes provide direct hydrocarbon indicators or DHI’s. However, this is still a developing technology and these DHI’s are very specialized and intimately related to local geologic conditions.
Geochemical Surveys
Analysis of soil samples, river water, formation water, and oil can be useful in some exploration programs.
- Soil analyses can indicate the presence of hydrocarbons beneath the surface, although they can indicate little about the depth of the reservoir.
- Analysis of surface water from rivers and streams might be indicative of the locations of oil seeps along the river banks. Sampling from several locations might be necessary to locate the seeps.
- Chemical analysis of subsurface formation water is often useful in correlations within a reservoir or establishing the differentiation of reservoirs.
- Oil composition analysis can provide age determinations of crude oil being produced from a well. In many cases, this compositional data can provide a link to the source rocks that generated the oil.
Compositional variations of crude oil are also useful in discriminating between different reservoir horizons. In some cases, oil ages and migration histories can be also determined by oil analyses.
Maps and Cross-Sections
Practically any type of geologic data can be represented on a map. Some of the most useful maps are those that present clear pictures of the distribution of geologic parameters. A surface geologic map is an example of this because it shows the distribution of individual rock formations over the area of the earth’s surface covered the map.
Contour maps can be used to illustrate many important parameters, such as rock unit or sedimentary facies thickness, or structural elevation (Figs. 10). They show variations that are useful in interpreting the complete geology of an area or individual characteristics within the entire data set.
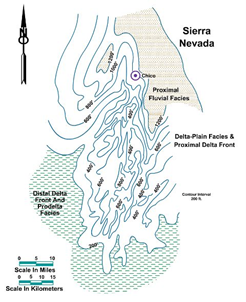
Figure 10 Facies map of a delta system. From Garcia, 1981. Permission to publish by AAPG.
Whereas maps represent information in plan view and provide a graphic view of geographic distribution, cross-sections present the same information in vertical view, and illustrate vertical relationships such as depth and thickness, as well as lateral changes of geologic properties (Fig. 11).
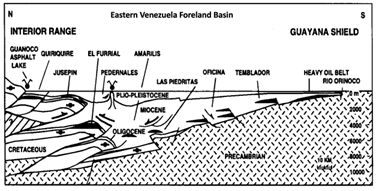
Figure 11 Regional cross-section of Eastern Venezueal Foreland Basin
To learn more about exploration techniques, we recommend enrolling in an online Geology skill module or our Virtual Basic Petroleum Geology Course available on-demand.