Acid Gas Removal: Preventing Liquid Carry Over to and Condensation in the Amine Contactor
Mahmood Moshfeghian, Ph.D. And Kindra Snow-McGregor, P.E.
Hydrogen sulfide and carbon dioxide are the principal objectionable acid gas components often present in natural gas, synthetic gas, and various refinery gas streams. These acid gas components must be removed for corrosion prevention in gas pipelines, process equipment, and for health and safety reasons. Reference [1] provides current acceptable concentration levels for these acid gases in various gas streams. Hydrogen sulfide removal often requires the production of sulfur in the sulfur recovery units to meet emission limits. Sulfur is a product used to produce sulfuric acid and fertilizers. Carbon dioxide removal is used for enhanced oil recovery and is required for carbon capture and sequestering (CCS) operations.
In natural gas treating, there are several processes available for removing the acid gases. Aqueous solutions of alkanolamines are the most widely used [1]. The alkanolamine (amines process is characterized as “mass transfer enhanced by chemical reactions” in which acid gases react directly or react through an acid-base buffer mechanism with the amine to form a nonvolatile ionic species. For further details of sour gas treating, please refer to references [1-5].
Several amines have been used for acid gas removal from natural gas streams. In this study only a tertiary methydeithanolamine (MDEA) will be considered. MDEA has the highest selectivity and lowest regeneration duty required, making it the solvent of choice for many applications. Due to the complexity of acid gas removal process and the corrosivity of the rich amine solutions, there are many operating problems that can occur. Likely the most common operating problem in these systems is amine foaming, which often results in failure to sweeten the inlet sour gas to the required specifications. The details of multiple operating issues and how to prevent them are discussed in PetroSkills-Campbell’s Gas Conditioning and Processing, G4 and G6 Courses (Gas Treating and Sulfur Recovery), as well as in our new Acid Gas Removal – Amine Focus Fundamentals three-day short course.
Foaming is caused by several factors, but the most common in gas processing plants are the condensation of liquid hydrocarbons, ingress of other contaminants in the process gas stream to the amine contactor, and amine degradation products. Symptoms of foaming include a sharp rise in contactor differential pressure, reduced rich amine flow leading to loss of liquid level in the contactor bottoms and severe carryover of amine into the outlet scrubber. It is nearly assured that the treated gas will go off-spec during a foaming event. In this TOTM, we will study the failure to sweeten due to the presence of hydrocarbon liquids in the feed sour gas. It is important to remove the hydrocarbon liquids from the inlet gas stream to prevent solvent contamination. In addition, any hydrocarbon liquid condensation must be avoided. The inlet gas hydrocarbon dewpoint increases as a result of the acid gas components being removed from the gas stream in the amine contactor. Refer to Chapter 4 of Reference [2] for more information. Thus, it is important to understand the hydrocarbon dewpoint of the gas stream as it flows up the contactor to ensure that the amine feed temperature is above the treated gas hydrocarbon dewpoint condition to prevent condensing liquid hydrocarbons in the amine. Predicting the hydrocarbon dewpoint of the treated gas stream requires a thorough understanding of the gas composition, including accurate heavy end characterization.
Case Study:
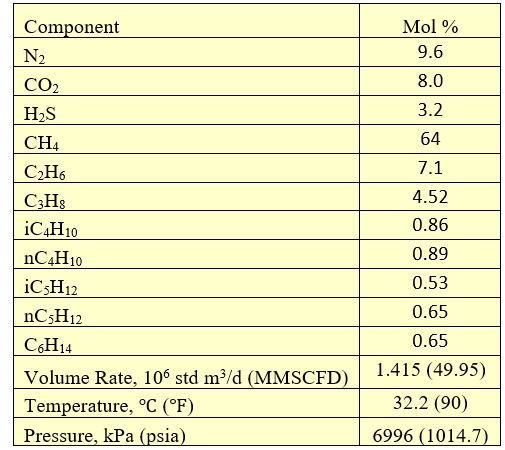
For illustration, we will consider sweetening of 1.415 x 10⁶ std m3/d (49.95 MMSCFD) of a sour natural gas with the composition, pressure, and temperature presented in Table 1. ProMax [6] simulation software with “Amine Sweetening – PR” property package was used to perform all the calculations. In addition, the mass + heat transfer option was used.
Table 1. Feed composition, volumetric flow rate and conditions
The following specifications/assumptions were made:
Contactor Column
a. Feed sour gas is saturated with water
b. Number of actual stages = 23
c. Pressure drop = 35 kPa (5 psi)
d. Lean amine solution temperature = Sour gas feed temperature + 5.56 ℃ (10 ℉)
Regenerator Column
a. Number of actual stages = 22 (excluding condenser and reboiler)
b. Rich solution feed temperature = 98.9 ℃ (210 ℉ )
c. Rich solution feed pressure = 105 kPag (15.2 psig)
d. Condenser temperature = 48.9 ℃ (120 ℉ )
e. Pressure drop = 35 kPa (5 psi)
f. Bottom pressure = 138 kPa (20 psig)
g. Reboiler duty = Specified “Steam Ratio” times circulation rate (Refer to Table 2)
Heat Exchangers
a. Lean amine cooler pressure drop = 21 kPa (3 psi)
b. Rich side pressure drop= 41 kPa (6 psi)
c. Lean side pressure drop = 35 kPa (5 psi)
HP Pump
a. Discharge Pressure = Sour gas feed pressure + 35 kPa (5 psi) + ΔPStatic
ΔPStatic = At least 130 kPa (19 psi) in just the elevation difference between the pump and the contactor inlet, plus some pressure drop on the FCV (unless you control flow via pump speed).
b. Efficiency = 65 %
Booster Pump
a. Discharge Pressure = Suction pressure + 55 kPa (8 psi) pressure drops in the L/R exchanger and lean amine cooler and ensures the HP pumps have enough NPSHA.
b. Efficiency = 65 %
Lean Amine Circulation Rate and Concentration
a. Varied to meet the target acid gas loading in the rich solution shown in Table 2
Rich Solution Expansion Valves
a. ΔP in the expansion valve to rich amine flash drum (valve 100) = 6310 kPa (915 psi)
b. ΔP in the expansion valve to the stripper (valve 101) = 440 kPa (64 psi)
A simplified process flow diagram for the case studied is presented in Figure 1 [6].
Table 2. Specified amine concentration, target rich solution acid gas loading, and steam ratios [4]


Figure 1. Simplified process flow diagram for an amine sweetening unit [6]
Results and Discussions:
Based on the description and specifications presented in the previous section, the process flow diagram in Figure 1 was simulated using ProMax BRE Software [6]. The simulation was performed for the steam ratio presented in Table 2. The results of the simulation are listed below:
- Treated sweet gas: H2S (3.98 ppmv) and CO2 (0.948 mol %)
- Lean amine circulation rate: 669 std gpm (152 std m3/h)
- Reboiler duty: 35.1 MMBtu/hr (10.28 MW)
- Amine make-up: 0.315 lb/hr (0.143 kg/h)
- Water make-up: 646 lb/hr (293 kg/h)
The amine make-up is required to compensate for the amine vaporization losses from the top of the contactor, regenerator, and rich amine flash drum. The Promax program shows a blowdown stream on the amine, however it should be noted that this is not typically done in the field. Amine reclaimers are utilized today to recover amine solution quality rather than bleed and feed approach that was used in the past. The water make-up is required to maintain the water balance as the acid gas and flash gas remove water from the system. The operating conditions in the contactor will result in condensation or vaporization of water, but this is of really no concern as the amine solution is aqueous. Overall, water is generally lost from the amine solution in the acid gas stream and makeup water is required. This makeup water must be free of minerals and other contaminants, or it may become a means of introducing agents that cause foaming.
Figure 2 shows the feed sour gas phase envelope on dry basis. The calculated cricondentherm, cricondenbar pressures and temperatures are shown in Table 3.

Figure 2. Feed sour gas phase envelope.
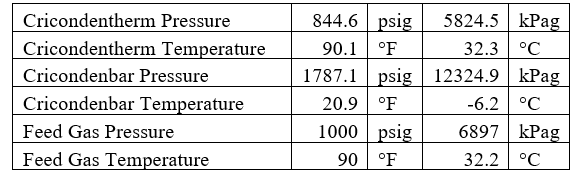
Table 3. Sour gas calculated cricondentherm and cricondenbar pressures and temperatures
The gas from the facility inlet separator flowing to the AGR unit is at its hydrocarbon dewpoint at 90°F (32.2 °C) at pressure of 1000 psig (6,897 kPag). Any cooling occurring in the piping between the inlet separator and the process will result in hydrocarbon liquid and water condensation. Because the feed gas pressure is above the cricondentherm pressure, additional liquid hydrocarbons may be formed due to retrograde condensation associated with pressure drop in the piping. In addition, the gas leaving the inlet separator may also contain a small amount of liquid hydrocarbons and produced water due to separator carryover.
Installation of a properly sized filter coalescer upstream of the acid gas removal unit (AGR) unit is recommended, as shown in Figure 3 for an amine unit to minimize any potential liquid hydrocarbon or produced water carryover from entering the amine system. In some facilities the filter coalescer may be installed at a considerable distance from the contactor. When this happens, the condensation illustrated in Figure 2 can lead to solvent contamination and significant operating problems.
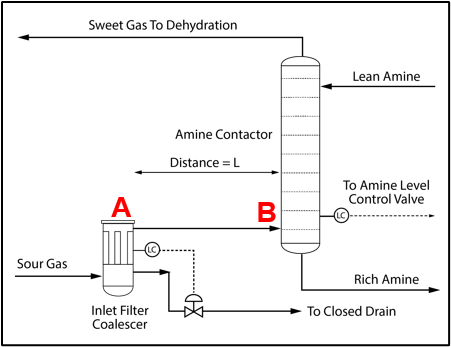
Figure 3. Process Flow Diagram for an Amine System Inlet [2]
To prevent hydrocarbon liquids condensation in the amine contactor, the lean amine inlet temperature should be roughly 5 to 10 °F (3 to 5 °C) warmer than the inlet sour gas. This temperature difference is referred to as the approach temperature (lean amine temperature approach to the inlet sour gas). Figure 4 presents the twenty-three actual-stages temperature profiles in the contactor column for two approach temperatures of 5, and 10 °F (2.8, and 5.6 °C)


Figure 4. Contactor gas-phase stage temperature profiles for two lean amine approaches to feed sour gas temperature
To check for possible hydrocarbon liquids condensation on a stage (or actual tray), the phase envelopes for the feed sour gas and the gas streams (on dry basis) leaving a few selected stages in the contactor column are illustrated in Figures 5 (FPS) and 6 (SI).


Figure 5-FPS. Process gas phase envelopes on dry basis in absorber (contactor) column for feed and selected stages.


Figure 6-SI. Process gas phase envelopes on dry basis in absorber (contactor) column for feed and selected stages
Note that as the acid gases are removed from process gas during its upward flow through the amine contactor, the gas hydrocarbon dewpoint curve shifts to the right and the two-phase region is expanded. Determining the required lean amine temperature approach requires knowledge of the phase envelopes of the gas as it flows through the contactor. Maintaining an adequate lean amine inlet temperature above the hydrocarbon dewpoint of the treated gas stream can aid in preventing foaming due to condensing liquid hydrocarbons.
Table 4 presents the estimated temperature values for a few selected points of Figures 5 and 6 based on the specified lean amine approach temperatures of 10 and 5 °F (5.6 and 2.8 °C) at the top of contactor and the feed sour gas temperature of 90 °F (32.2 °C).

Table 4. Estimated temperature margins for two lean amine approach temperatures


Notice that in the 10 °F (5.6 °C) case the stage operating temperature is to the right of (warmer than) the hydrocarbon dewpoint temperature by 8.0 °F (4.5 °C), thus no hydrocarbons vapor from gas stream condenses and solvent contaminations do not happen.
This is not the result for the 5 °F (2.8 °C) case (Figure 7). The inlet amine solution is slightly warmer than the hydrocarbon dewpoint temperature of the treated gas by 3.0 °F (1.7 °C) with a low safety factor. The potential would exist for some liquid hydrocarbon condensation if the amine were to cool slightly or if additional acid gases were removed from the gas stream.
Figure 7. Gas-phase stage temperature profile and process gas phase envelopes on dry basis in absorber (contactor) column for feed and selected stages
In a number of facilities, the expansion of the treated gas phase envelope and inadequate lean amine inlet temperature (too cool) was the primary cause of liquid hydrocarbons condensing in the amine solvent resulting in severe operating problems. This will, result in foaming and potential failure to sweeten the gas adequately. Notice in the case with the smaller temperature approach, one would have assumed that the amine solvent temperature would be sufficiently high enough to prevent liquid hydrocarbons from condensing out. In this example, the 5°F (2.8°C) approach temperature on the lean amine had a relatively small safety margin above the hydrocarbon dewpoint of the gas stream. If the amine temperature was not tightly controlled and it entered the amine contactor at a temperature 3°F (1.7°C) cooler, then hydrocarbon liquid condensation would likely occur. Without detailed knowledge of the treated gas phase envelope and doing this type of analysis one could easily assume that the liquid hydrocarbons were entering the system from the inlet filter coalescer upstream of the AGR.
Conclusions:
Based on the results obtained for the case study considered in this TOTM, the following conclusions can be made:
- To prevent solvent contaminations and foaming the following suggestions can be utilized.
a. Install a properly sized scrubber followed by an adequately sized filter coalescer directly upstream of the amine contactor column.
b. Select an appropriate approach temperature to feed gas temperature for the lean amine at top of contactor based on the treated gas composition phase envelope.
c. Plot the process gas streams hydrocarbon dewpoint curves for selected stages and make sure they are located to the left of operating temperatures (Figures 5 and 6).
d. To avoid hydrocarbon liquid in contactor, select the lean amine temperature to yield ΔTmin= or > 5.4 °F (3 °C); where ΔT= Stage gas phase temperature – gas phase cricondentherm temperature is the minimum for stage 1 (sweet gas) or ΔTmin = ΔTstage1.
To learn more about similar cases and how to minimize operational problems, we suggest attending our G6 (Gas Treating and Sulfur Recovery), G4 (Gas Conditioning and Processing), PF81 (CO2 Surface Facilities), PF4 (Oil Production and Processing Facilities), courses.
References:
Maddox, R.N., and Morgan, D.J., Gas Conditioning and Processing, Volume 4: Gas treating and sulfur Recovery, Campbell Petroleum Series, Norman, Oklahoma, 1998.
Campbell, J.M., Gas Conditioning and Processing, Volume 1: The Basic Principles, 9th Edition, 1st Printing, Editors Hubbard, R., and Snow–McGregor, K., Campbell Petroleum Series, Norman, Oklahoma, 2014.
Campbell, J.M., Gas Conditioning and Processing, Volume 2: The Equipment Modules, 9th Edition, 1st Printing, Editors Hubbard, R., and Snow–McGregor, K., Campbell Petroleum Series, Norman, Oklahoma, 2014.
GPSA Engineering Data Book, Section 21, Volume 2, 13th Edition, Gas Processors and Suppliers Association, Tulsa, Oklahoma, 2012.
Moshfeghian, M., Bell, K.J., Maddox, “Reaction Equilibria for Acid Gas Systems, Proceedings of Lawrence Reid Gas Conditioning Conference, Norman, Oklahoma, 1977
ProMax 5.0, Bryan Research and Engineering, Inc., Bryan, Texas, 2021.