Determining Traces of Methanol in the Gas Sweetening Process - Updates
October 1, 2022
|
Tip of the Month
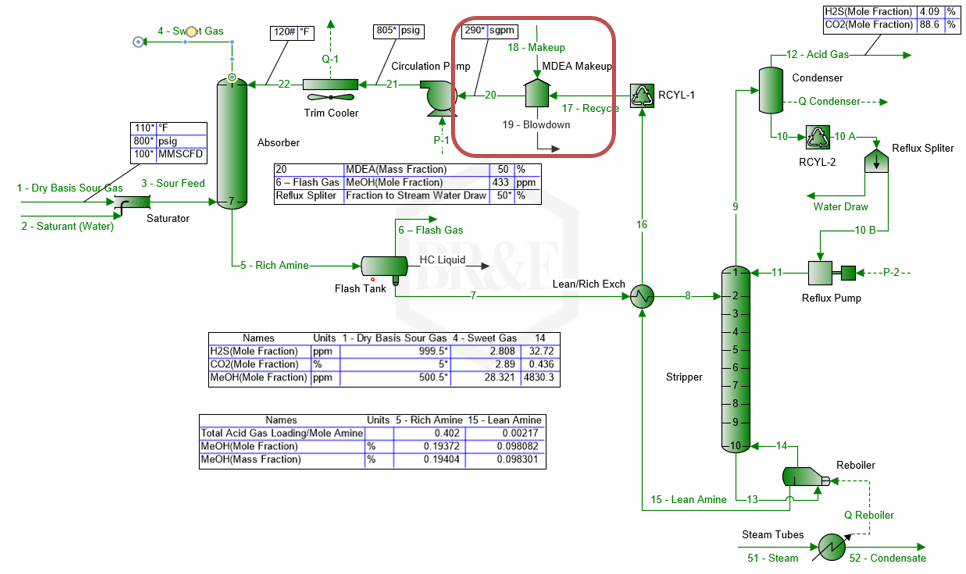
The July 2016 tip of the month (TOTM) considered the presence of methanol in the sour gas stream and determined the quantitative traces of methanol ending up in the sweet gas, flash gas and acid gas streams. To achieve this, the tip simulated a simplified MDEA gas sweetening unit by computer. That tip also studied the effect of feed sour gas temper...
View Article

The Realities of Big Wind and Solar and the Need for Responsibly Produced Hydrocarbons – Part 1 Why Energy Density Matters
September 1, 2022
|
Tip of the Month
The U.S. recently passed the Inflation Reduction Act (IRA) of 2022 which “doubles down” on environmental justice and renewable energy [1]. The newly created Clean Electricity Investment Tax Credit (CEITC) is available for any investment in qualified electric generators and storage facilities that are placed in service after December 31, 2024, that...
View Article
Part-2: Estimation of Solubilities of Benzene, Toluene and Ethylbenzene into Acid Gas Loaded Aqueous MDEA Solutions
August 3, 2022
|
Tip of the Month
Continuing July 2022 tip of the month, this tip demonstrates applications of the models developed based on the experimental VLE and VLLE data measurements presented in the Gas Processors Association (GPA) research report RR-242. The models will be used for estimation of solubilities of a mixture consisted of Benzene, Toluene, and Ethylbenzene in lo...
View Article

Gasoducto de Larga Distancia Nord Stream - Parte 3 Aplicación de las ecuaciones Básicas y AGA para aproximar el flujo máximo en un gasoducto de larga distancia
July 25, 2022
|
Tip of the Month
Introducción
En seguimiento de los dos últimos Previos del Mes (TOTM/PDM) sobre el gasoducto Nord Stream de larga distancia, el cual transmite el gas natural desde Rusia hasta Europa, este PDM resume la aplicación de varias correlaciones/ecuaciones disponibles para determinar la capacidad máxima de susodicha línea de larga distancia. Adicionalmen...
View Article
Estimation of Solubilities of Selected Hydrocarbons Compounds in Treating Solvents
This tip demonstrates applications of the models developed based on the experimental VLE and VLLE data measurements presented in the Gas Processors Association (GPA) research report RR-242. The models can be used for estimation of solubilities of selected hydrocarbons in pure water, unloaded amine solution, loaded amine solution with CO2 and/or H2S...
View Article

Nord Stream Long Distance Gas Pipeline – Part 3 Application of Basic and AGA equations for estimating maximum gas flow in a long‐distance pipeline
Following on the previous two tips of the month (TOTMs) on Nord Stream long distance pipeline for gas transmission from Russia to Europe, this TOTM discusses the application of various long distance gas transmission correlations/equations that are available to determine the maximum gas capacity of a long distance pipeline. In addition, calculations...
View Article